BCMG Insights · Strategic Investment Research
Australia and Japan: The Second Wave
From the 1973 oil shock to strategic capital. How Japan's economic-security era could change the way Australia develops its resources.
August 2026
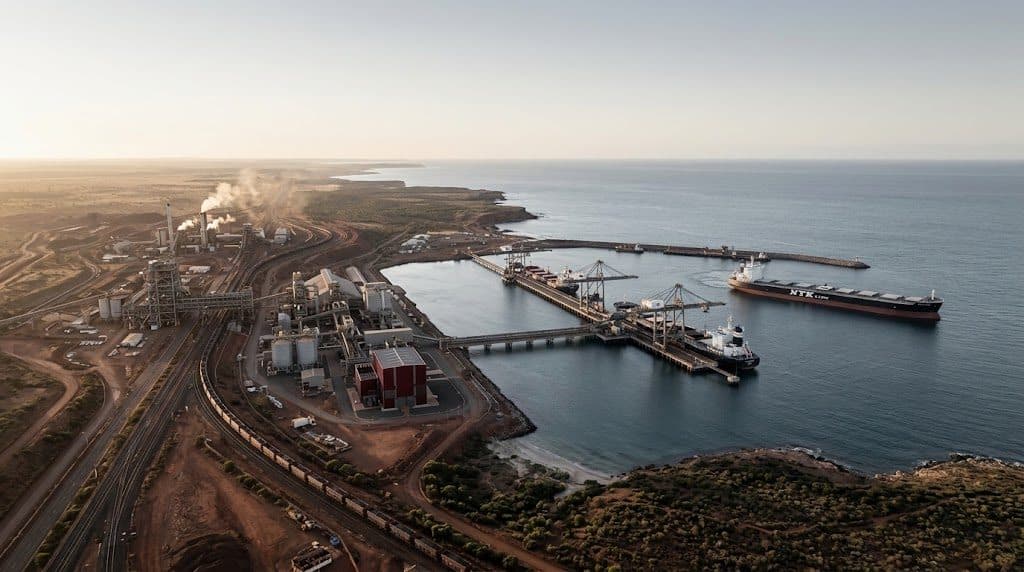
The First Wave, still running — a Japanese-flagged bulk carrier loading at an Australian export terminal.
Contents
- 01The Thesis in One Page
- 02The Relationship, in Numbers
- 03The First Wave: How Japan's Problem Built Australia's Resource Economy
- 04The Machine Australia Built Next: Mums, Dads and the ASX
- 05What Changed in Japan
- 06The Rehearsal Nobody Noticed: Lynas, 2011
- 07The Second Wave Mechanism: Who Carries the Risk
- 08The Evidence: May 2026, Six Projects, and a Refinery in Wagerup
- 09Where the Model Applies, and Where It Doesn't
- 10The Discipline: Strategic Does Not Mean Uneconomic
- 11The BCMG Second Wave Scorecard
- 12What Changes for Companies and Investors
- 13Conclusion: The Second Wave
01
The Thesis in One Page
The Takeaway
A resource in the ground is not an industry. Japan has stopped treating strategic materials as procurement and started treating them as economic security, and the capital behind that shift runs straight through Australia. The Second Wave will be measured in purity, qualification and trust, not tonnes.
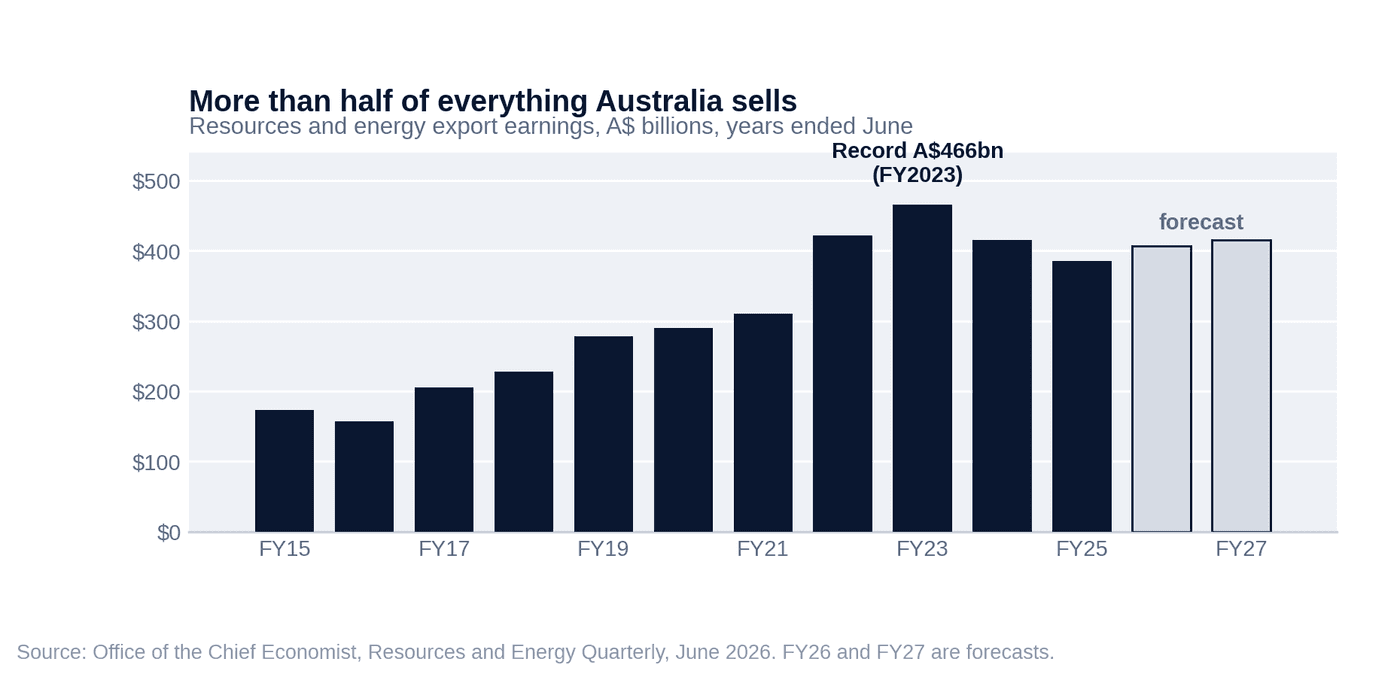
Australia has one of the great natural resource endowments on earth. Coal, iron ore, gas, lithium, rare earths, nickel, mineral sands, graphite, fluorite, uranium, and a long tail of deposits most investors have never heard of. In 2022-23, resources and energy earned Australia a record A$466 billion in export revenue, well over half of everything the country sells to the world (Office of the Chief Economist).
But a resource in the ground is not an industry. It only becomes one when somebody funds the whole chain: exploration, development, infrastructure, processing, qualification, production, and decades of reliable supply.
For the past forty years, Australia has mostly relied on its own capital markets to do that job. The ASX funded exploration. Retail investors took the geological risk. Institutions followed the discoveries. Foreign customers provided the demand. It built one of the most successful resource industries in history.
Something is now changing on the other side of the relationship. Japan has stopped treating access to strategic materials as procurement and started treating it as economic security. Its new Growth Strategy sets out seventeen strategic fields and sixty-two key products and technologies, with more than ¥370 trillion of public and private domestic investment expected across them by FY2040 (Cabinet Secretariat), and two of those fields, critical minerals and resource security, run straight through Australia. The machinery to act is already deployed: on 4 May 2026 the two governments elevated critical minerals to a core pillar of the relationship and named six Australian projects, and in July the first of them reached a final investment decision (MOFA and PM&C; JOGMEC).
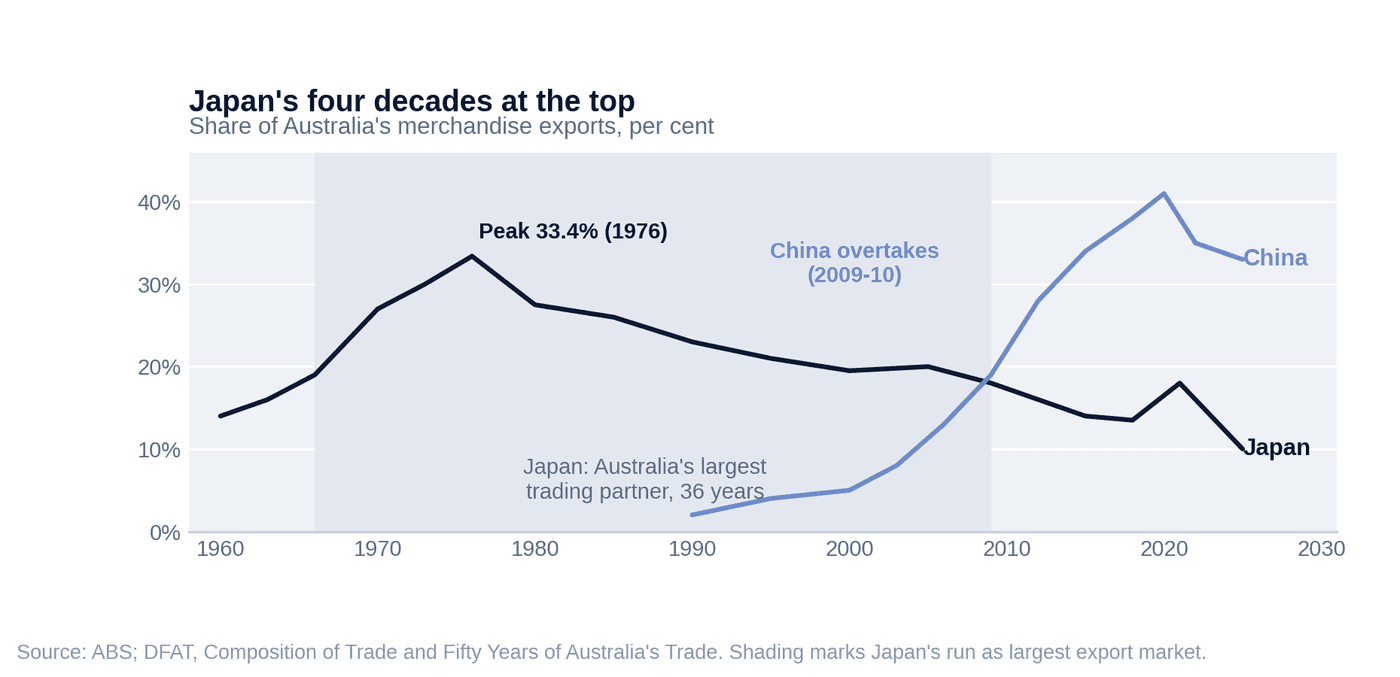
This is not a new relationship. It is the second time Japan's strategic anxiety has reshaped how Australian resources get developed. The first time, after the 1973 oil shock, the result was the coal, iron ore and LNG export economy Australia still runs on. Japan became Australia's largest trading partner in the early 1970s and held the position for 36 years (DFAT).
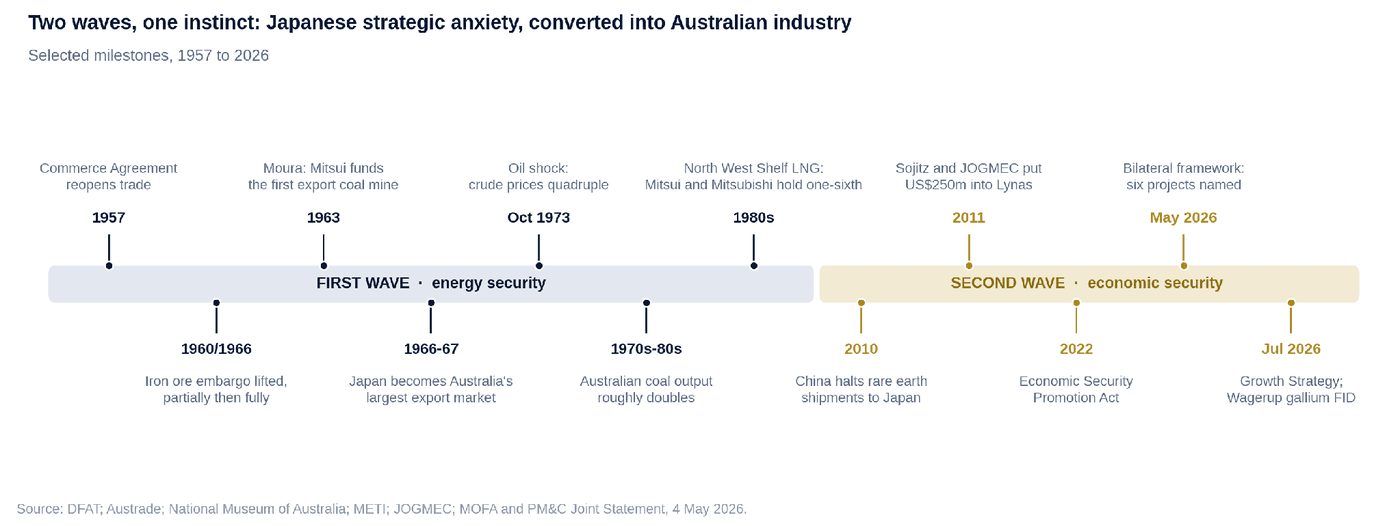
We call what is starting now the Second Wave. The First Wave changed who developed Australia's resources. The Second Wave could change what gets developed, how it is financed, and how much of the supply chain Australia keeps onshore.
The difference this time is where the value sits. The First Wave was measured in hundreds of millions of tonnes. The Second Wave will be measured in purity, qualification and trust, in markets where global supply can be a few hundred tonnes a year. The tonnages are smaller. The stakes are not.
02
The Relationship, in Numbers
The Takeaway
The relationship is already enormous: A$97.5 billion of two-way trade and A$282.9 billion of Japanese investment. What Australia has never had is the second kind of capital, patient and strategic. That asymmetry is the subject of this report.
Before the history, the scale. Every figure below is from government or official statistical sources, detailed in the notes.
- A$97.5 billion of two-way trade in 2025. Japan is Australia's third-largest trading partner and second-largest export market, taking A$65.1 billion of Australian exports (DFAT).
- 36 years. How long Japan held the position of Australia's largest trading partner after taking it in the early 1970s. On the narrower measure of largest export market alone, the run was longer still, from 1966-67 to 2009-10 (DFAT).
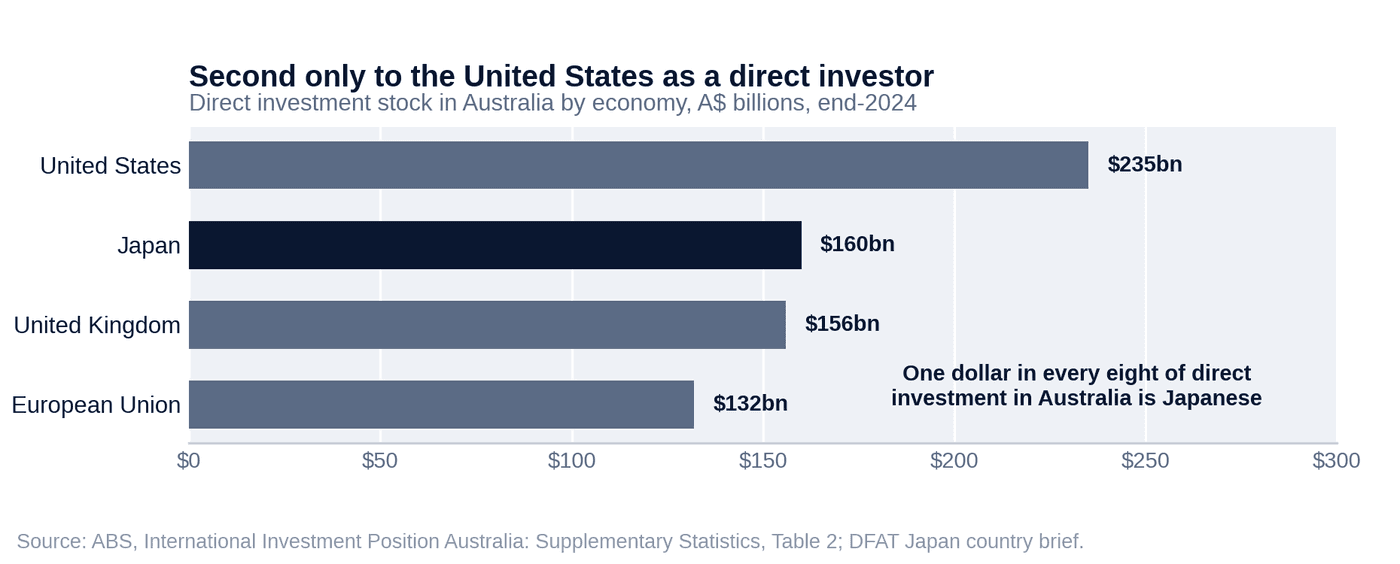
- A$282.9 billion of total Japanese investment in Australia at end-2024, the fourth largest of any country. On direct investment Japan ranks second, at A$159.5 billion, one dollar in every eight of foreign direct investment in Australia (ABS; DFAT).
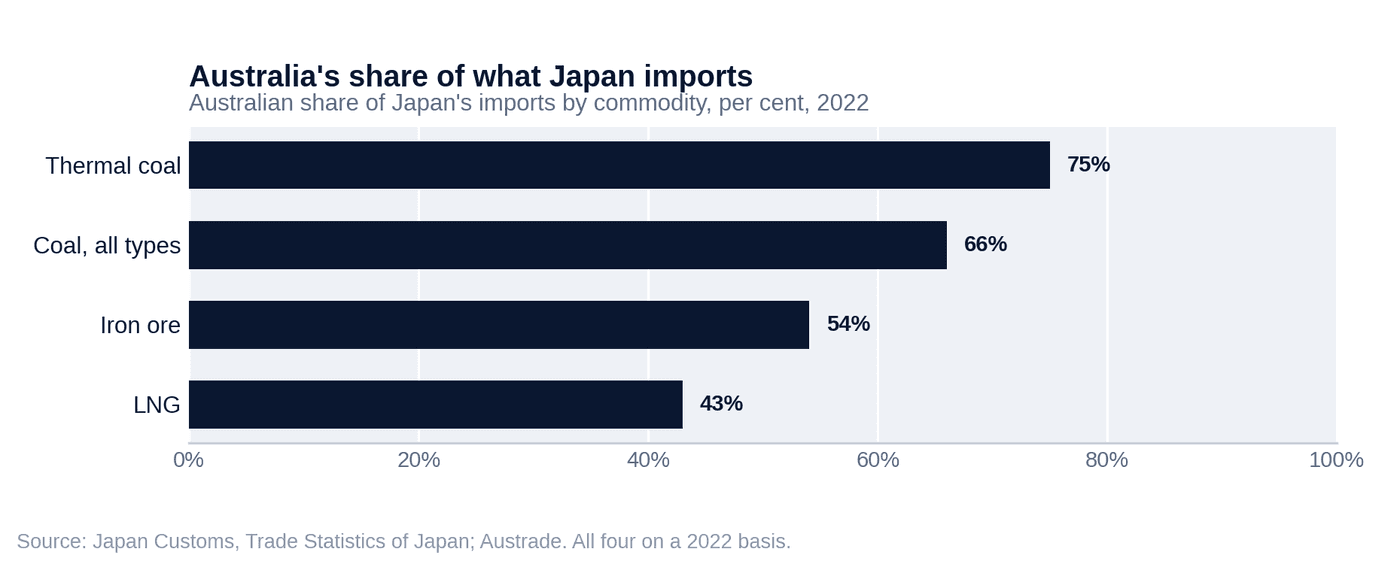
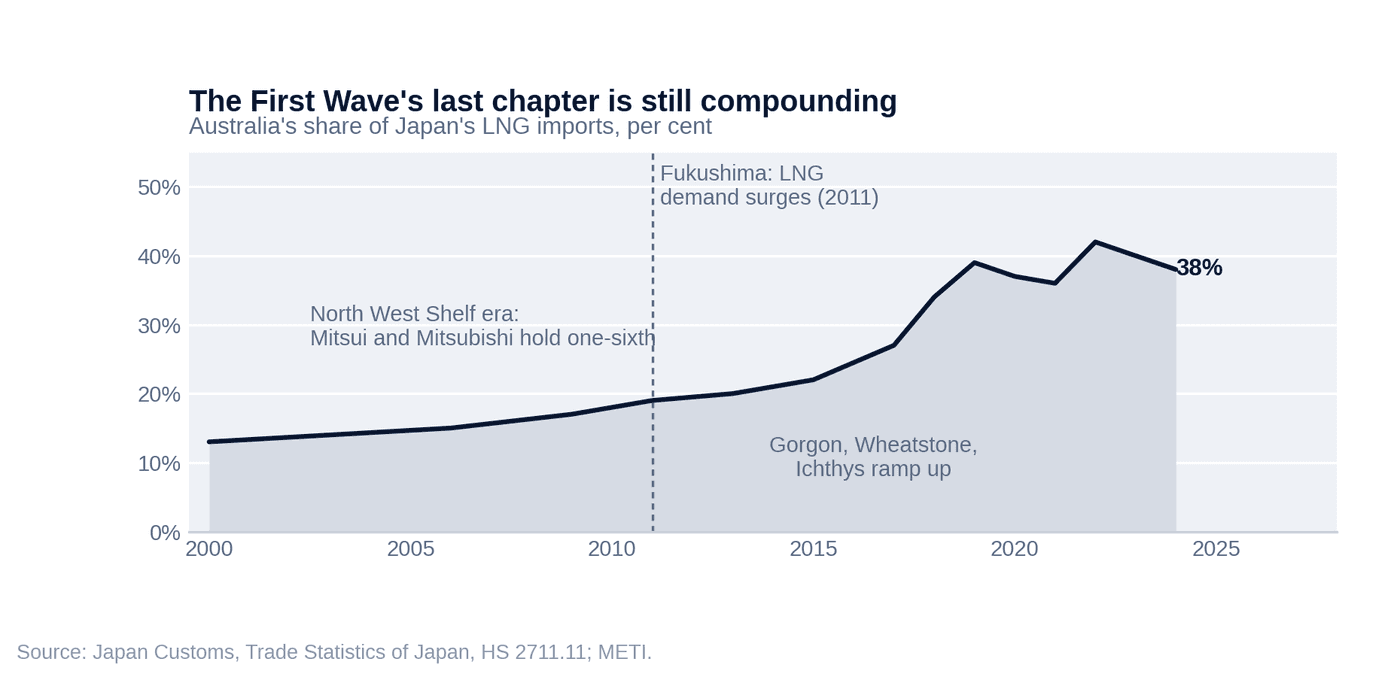
- 43% of Japan's LNG imports came from Australia in 2022, its largest supplier of both LNG and coal (Japan Customs).
- 66% and 54%. Australia's share of Japan's coal imports and iron ore imports in 2022 (Japan Customs; Austrade).
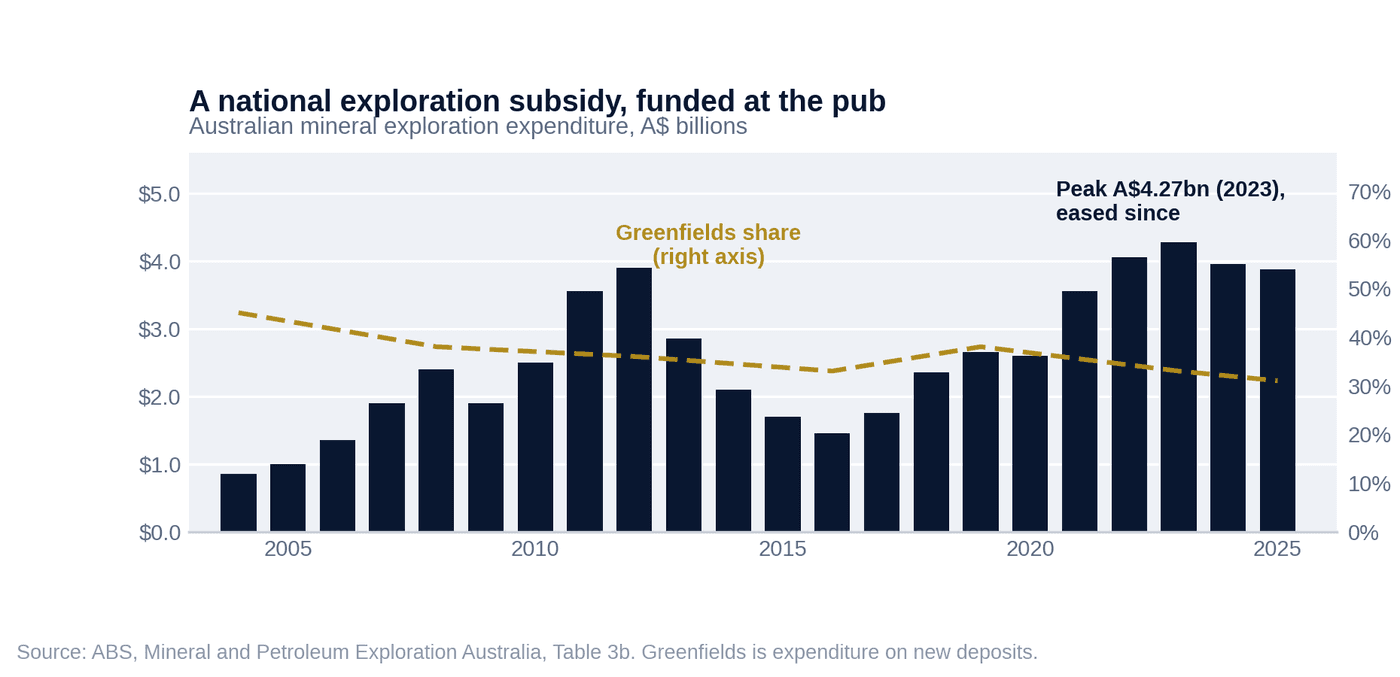
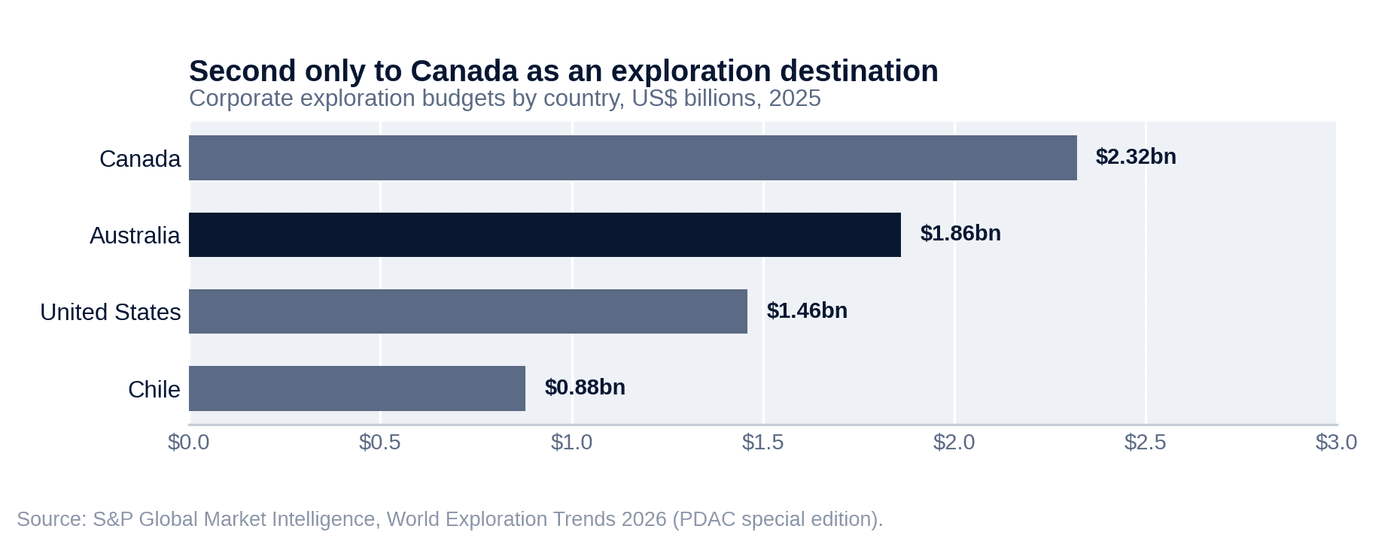
- A$4.27 billion of mineral exploration expenditure in Australia in 2023, the peak of the current cycle. Spend has eased since, to about A$3.9 billion, and Australia remains the world's second-largest exploration destination after Canada (ABS; S&P Global).
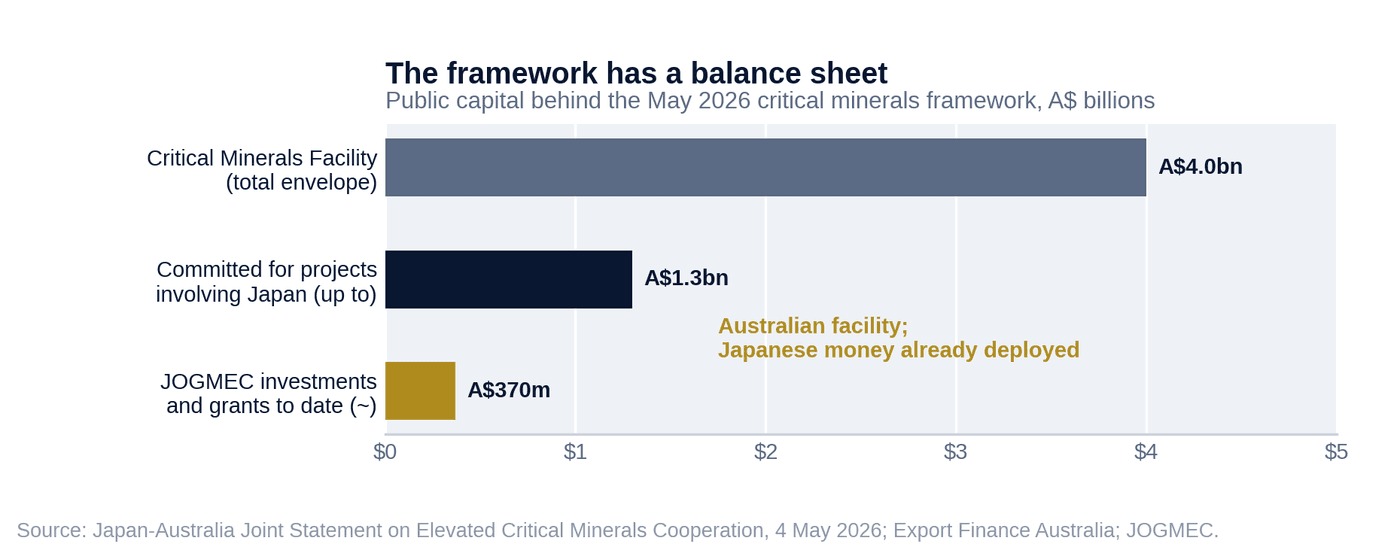
- Up to A$1.3 billion plus about A$370 million. Australia's committed support through the Critical Minerals Facility and Export Finance Australia for projects involving Japan, and JOGMEC's investments and grants to date, under the May 2026 framework (Joint Statement).
- ¥370 trillion+. Cumulative public and private domestic investment expected across the 62 key products and technologies of Japan's Growth Strategy through FY2040 (Cabinet Secretariat).
Two countries. One resource system. Two very different kinds of capital. That asymmetry is the subject of this report.
03
The First Wave: How Japan's Problem Built Australia's Resource Economy
The Takeaway
Australia's own export ban, not its geology, was the binding constraint. Japan did not simply buy Australian coal and iron ore: it funded the mines that produced them, arriving as customer, financier and contract at once. The 1973 oil shock turned that commercial habit into statecraft.
A politically brave agreement
To understand what is beginning, it helps to remember how strange the original arrangement was.
In the 1950s, Australia and Japan were a decade removed from war. The 1957 Commerce Agreement reopened trade between them while the memory was still raw (DFAT; Australian parliamentary histories). It was, at the time, a politically brave document. It turned out to be one of the most consequential economic agreements Australia ever signed.
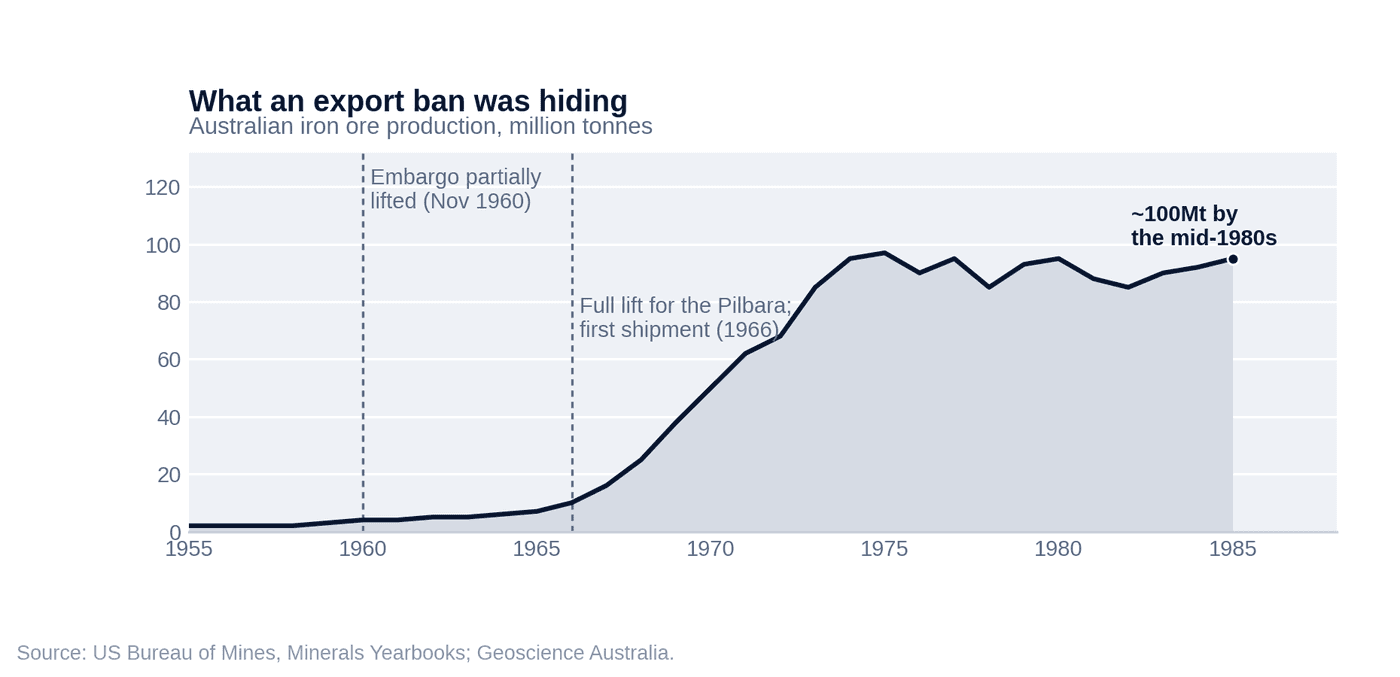
The second unlock was self-inflicted. Australia had banned iron ore exports since 1938, convinced it barely had enough ore for itself. The embargo was partially lifted in 1960, permitting limited exports from smaller deposits, and fully removed for the major high-grade deposits, the Pilbara among them, in 1966 (National Museum of Australia). From there, the geology of the Pilbara met the demand of the Japanese steel industry. What followed was not a trade so much as a construction project: mines, railways, ports and towns, built at speed, and underwritten by long-term contracts with Japanese steel mills. Within a decade of the embargo lifting, Japan was Australia's largest trading partner. It stayed there for 36 years.
The Moura template
The template for how it would be financed had already been drawn in Queensland.
In 1963, Mitsui joined Australia's Thiess and America's Peabody to develop the Moura coal mine in the Bowen Basin. Mitsui fully funded the exploration, took equity in the venture, and marketed the coal into Japan. It was the first project of its kind by a Japanese company in Australia, and Australia's first export coal mine. Mitsui itself describes it as the model for the foreign investment that followed in Australian resources (Mitsui & Co. (Australia); Austrade).
Read that structure carefully, because it is the whole story. Japan did not say “we will buy Australian coal.” Japan said “we need secure coal, so we will help create the Australian mine that produces it.” Customer, capital and contract arrived together, before the industry existed.
The sogo shosha, the great trading houses, were the instrument. They could see Japanese demand from the inside, sign the long-term offtake, put money into the ground in Australia, and carry the production home. Mt Newman followed in iron ore in 1965 (Austrade). Salt, more coal and more iron ore followed through the decade. Austrade's own history is blunt about the mechanism: Japanese long-term purchase agreements from trading houses, steel mills and power companies were critical to the success of Australia's major resource projects, because they gave everyone else the confidence to fund them.
The 1973 shock, and what it built
Then came October 1973. The oil embargo quadrupled crude prices and exposed the central fact of the Japanese economy: oil supplied roughly three-quarters of Japan's primary energy, and virtually every barrel of it was imported, mostly from the Middle East (METI).
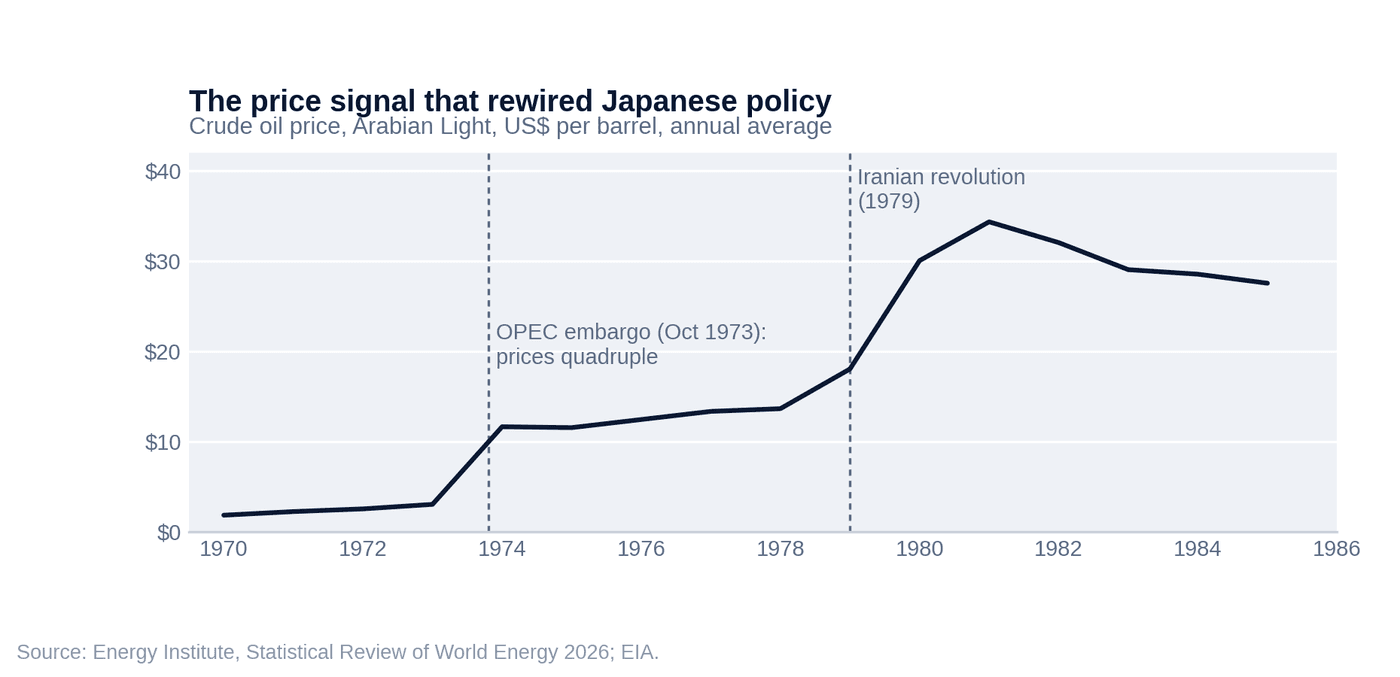
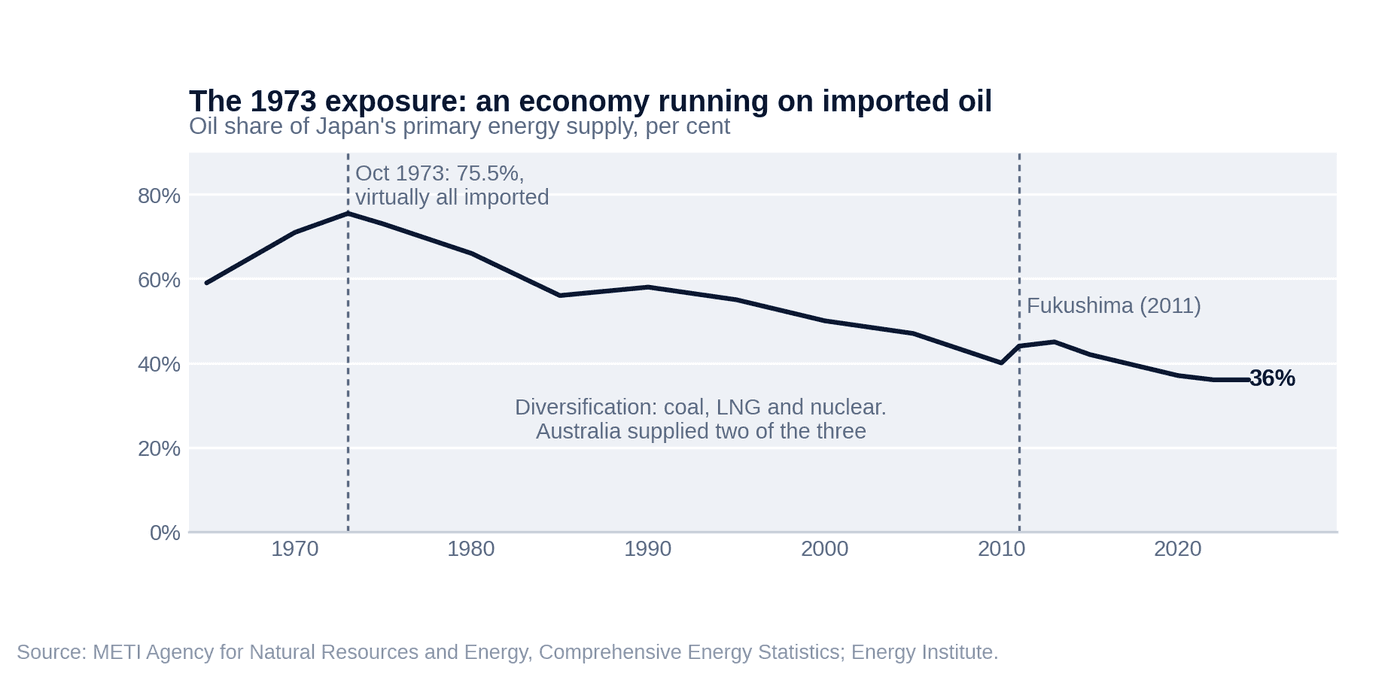
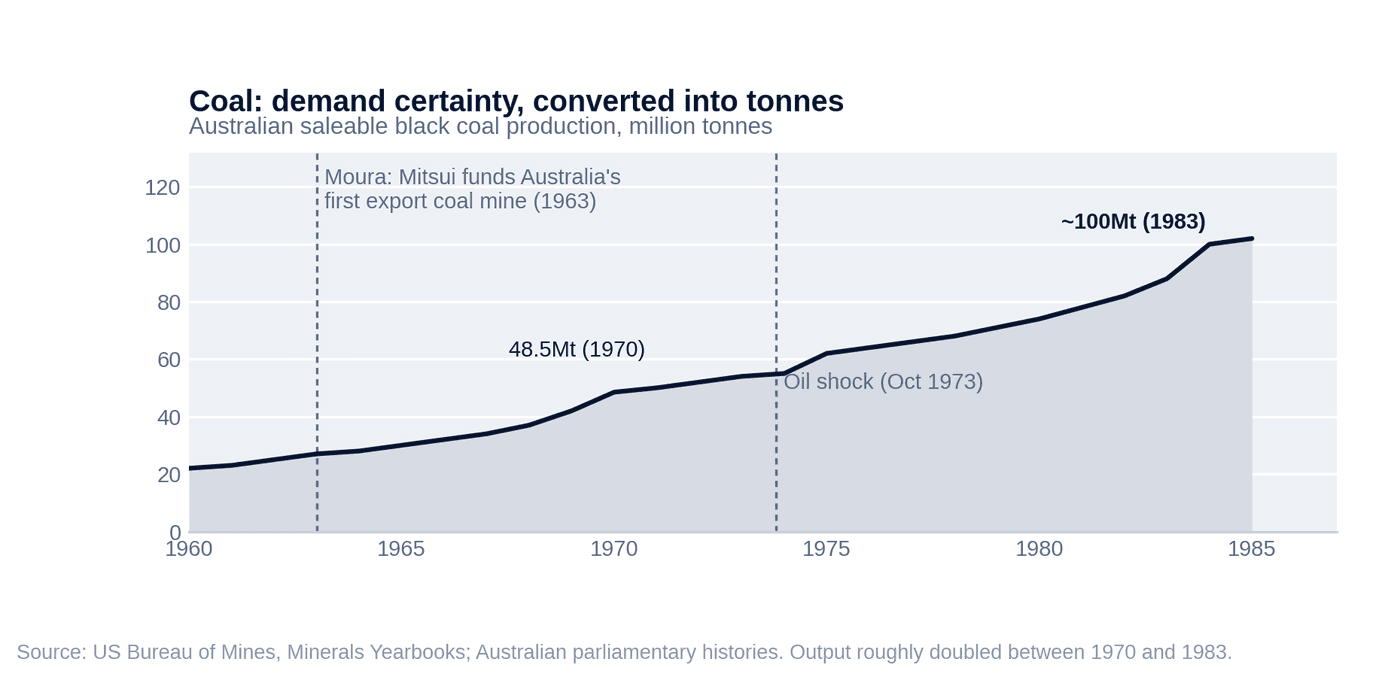
The shock rewired Japanese policy overnight. Energy security stopped being an economics question and became a national one. Japan diversified away from oil wherever it could, and Australian coal was one of the great beneficiaries: Australian coal production roughly doubled between 1970 and the early 1980s (US Bureau of Mines), with the contracts, equity stakes and infrastructure that carried it substantially built on Japanese demand certainty.
The arc ran all the way to gas. When the North West Shelf LNG project was sanctioned in the 1980s, Mitsui and Mitsubishi jointly held one sixth of it, and the foundation customers were Japanese utilities (Austrade). Four decades later Australia is still Japan's largest LNG supplier, providing around 40 per cent of its imports today. Same model, bigger numbers, and it never stopped compounding: by 2022 Australia was supplying 66 per cent of Japan's coal imports and about half of its iron ore (Japan Customs; Australian Embassy Tokyo).
That is what made the First Wave a wave rather than a boom. It was not just more buying. It was a change in the capital architecture: Japanese strategic need, converted into long-term contracts and trading-house investment, converted into Australian mines, railways and ports. Japan got security. Australia got an export economy. Fifty years later, both are still collecting the dividends.
04
The Machine Australia Built Next: Mums, Dads and the ASX
The Takeaway
The ASX is the best discovery machine in the world and a poor developer of strategic projects. Retail money funds drill holes; it cannot fund processing plants, qualification or decade-long supply chains. That gap, one step downstream of discovery, is where the Second Wave plugs in.
Here is the part of the story Australians know so well they forget how unusual it is.
Once the First Wave proved Australian resources could be developed at scale, Australia built its own machine for finding them, and it was nothing like Japan's. It was noisy, speculative, democratic and public. It was the ASX.
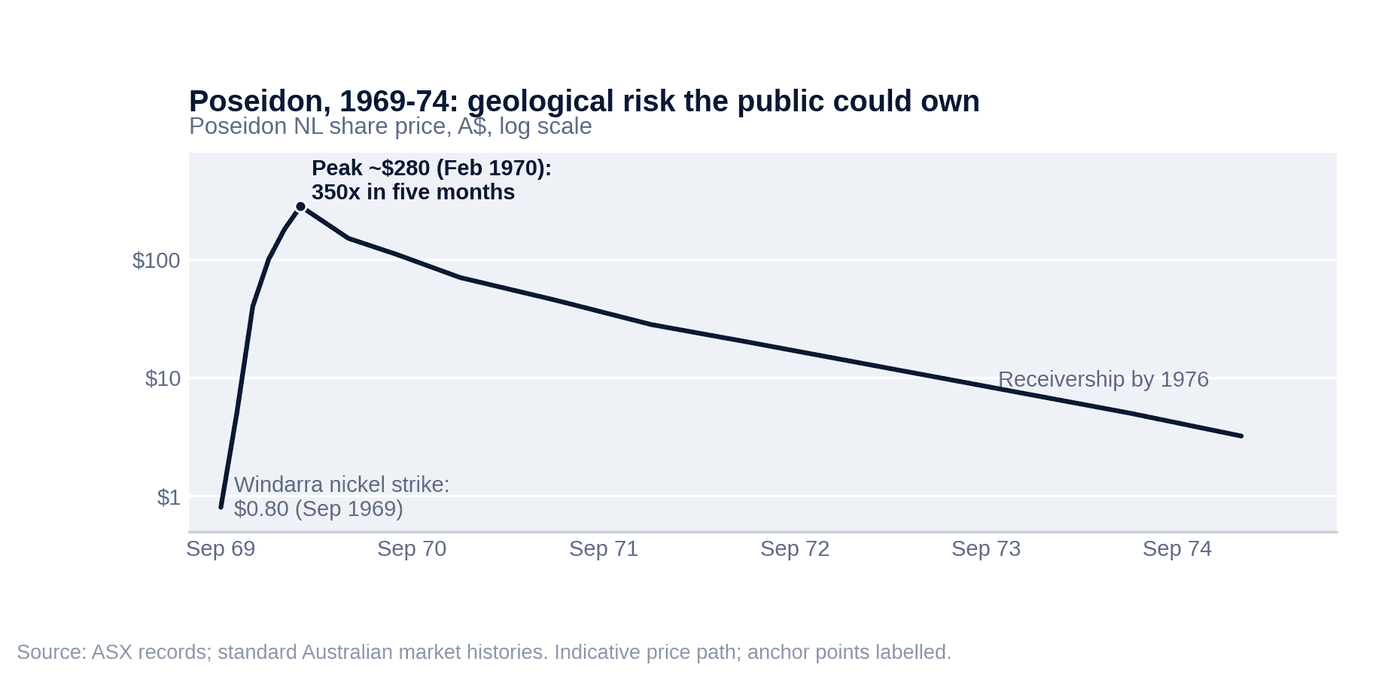
The model became familiar to every Australian with a broking account. An entrepreneur pegs ground. A junior explorer lists. Mums and dads fund the drilling. Most holes miss. Occasionally one doesn't, and the market does the rest: retail money first, institutions after the discovery, banks once the cash flows are visible. Poseidon set the archetype in 1969, when a nickel strike at Windarra took the shares from around 80 cents to a peak near $280 within months (ASX records; standard market histories), and taught a generation that geological risk was something ordinary people could own a piece of.
It is easy to be snobbish about this system. It would also be wrong. Australians put A$4.27 billion into mineral exploration in 2023 and, even after the cycle eased, still spend close to A$4 billion a year (ABS). On S&P Global's count Australia has been the world's number one or number two exploration destination every year this decade, currently second only to Canada. The ASX lists more resources companies than any other exchange on earth (ASX). The junior market is, in effect, a national exploration subsidy funded voluntarily at the pub, and as a discovery machine it has few rivals anywhere in the world.
But the machine has a known weakness, and it sits exactly one step downstream of the discovery.
Retail capital is brilliant at funding a drill hole and poor at funding a processing plant. Of that exploration spend, more than two-thirds goes into brownfields work around known deposits; the genuinely new stuff is the minority even at the discovery stage, and the greenfields share has been falling for twenty years (ABS). And the moment a project requires new processing technology, high-purity output, years of customer qualification, large upfront capital and specialist infrastructure, the speculative model runs out of road entirely. A deposit can be geologically exceptional and still unbankable. A material can be strategically critical and still unable to raise $500 million on a junior board.
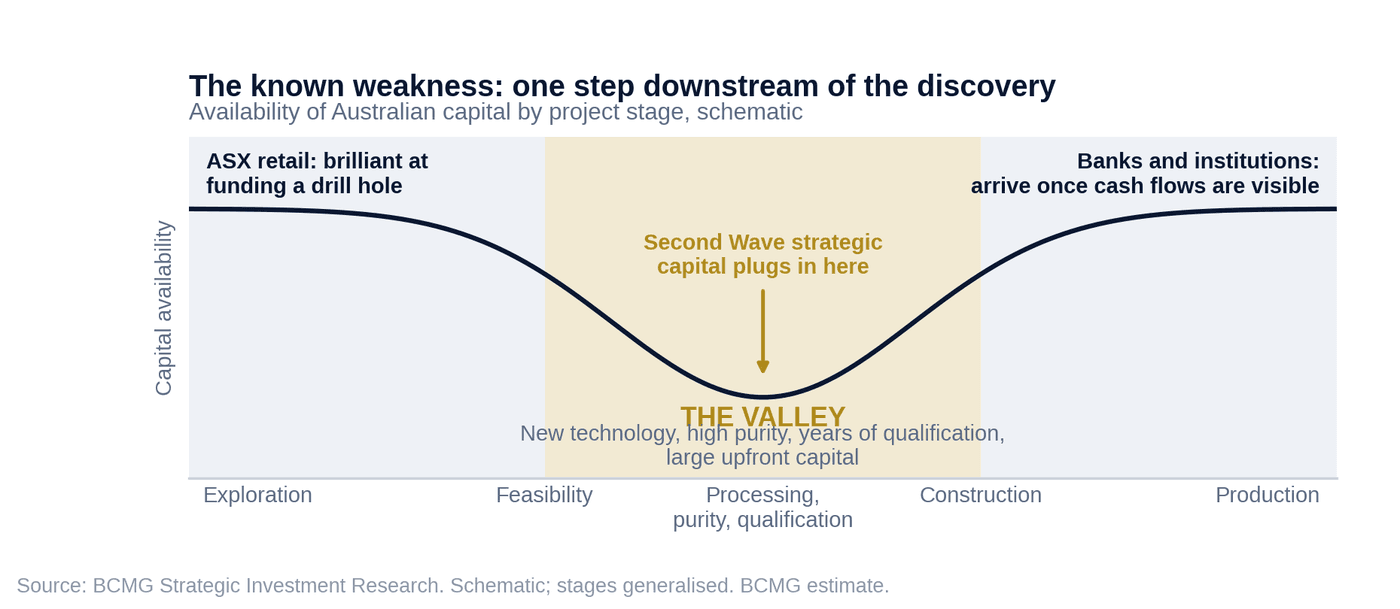
So Australia ended up with a strange asymmetry. A world-class system for discovering resources, attached to a much weaker system for strategically developing them. For iron ore and coal, it never mattered, because the First Wave architecture did the heavy lifting. For the materials that matter next, it matters enormously.
Which brings us back to Japan.
05
What Changed in Japan
The Takeaway
Japan's vulnerability is no longer the oil tanker but the supply chain. The mine is not the bottleneck; the permission slip is. Tokyo learned that in 2010, a decade before everyone else, and has been building the machinery to act on it ever since.
Japan's problem in 1973 was energy. Japan's problem in 2026 is more subtle and, in some ways, more dangerous.
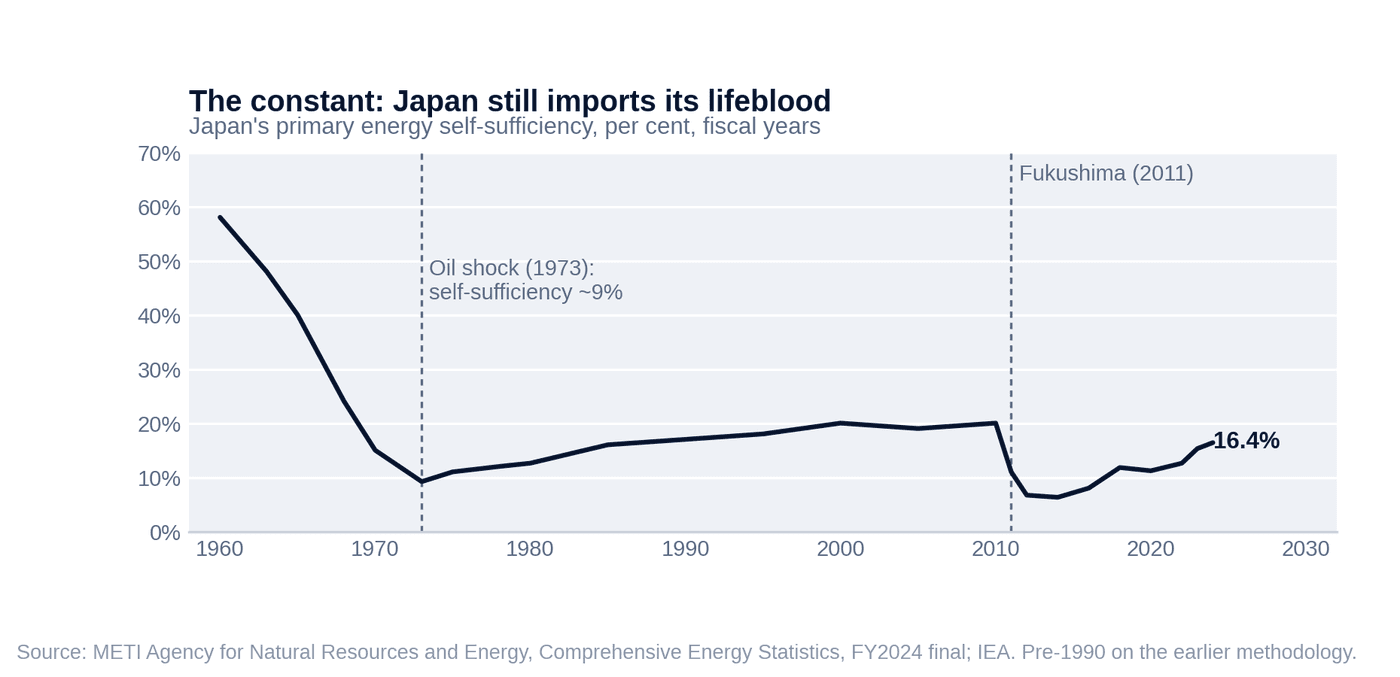
Start with the constant: Japan still imports its industrial lifeblood. Its energy self-sufficiency was 16.4 per cent in FY2024, among the lowest in the OECD, and the government's own target is 30 to 40 per cent by FY2040 (METI). What has changed is the shape of the vulnerability. Modern Japanese industry does not just consume raw materials. It consumes qualified materials: the right compound, at the right purity, in the right form, from a supplier who will still be allowed to ship it next year. Semiconductors, batteries, magnets, power electronics, defence systems.
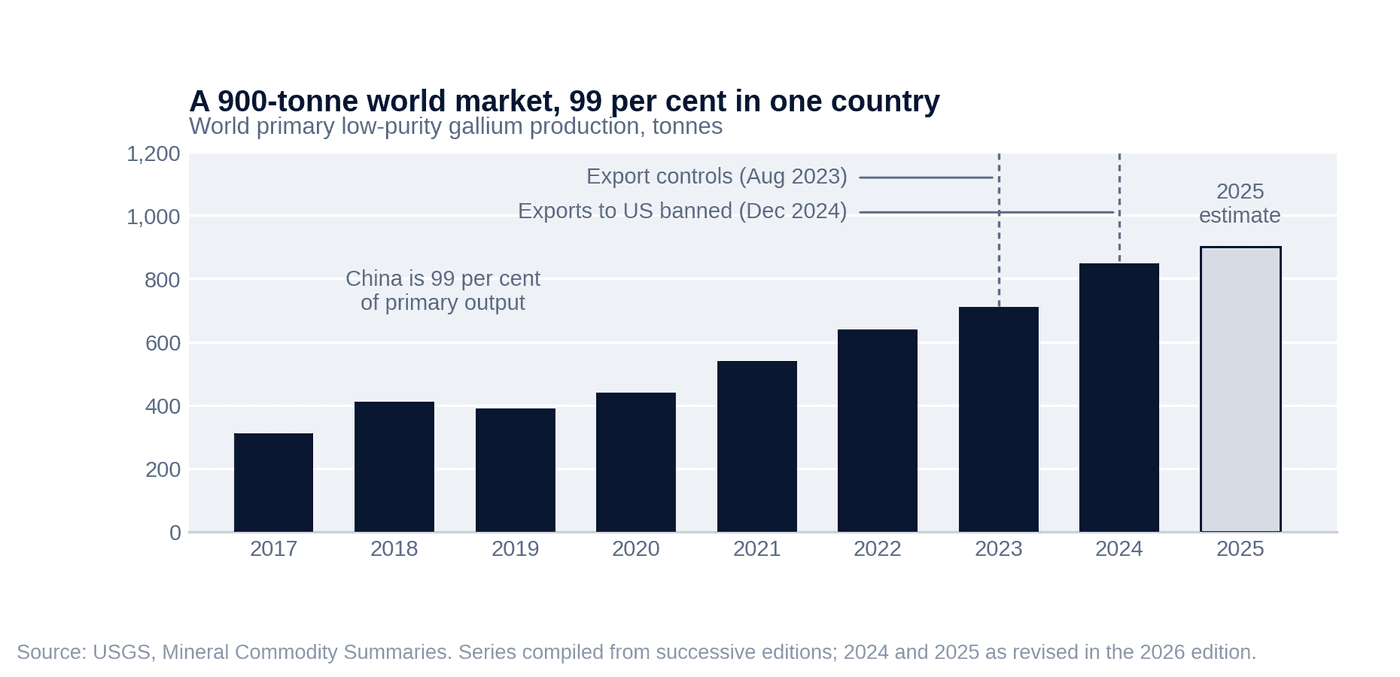
In these chains, the mining is often the easy part. The concentration sits in the middle. On IEA figures, China accounts for 91 per cent of global refined output of magnet rare earths and 94 per cent of sintered permanent magnet production. In battery-grade graphite the concentration is close to absolute: less than one per cent of uncoated spherical graphite, the material that goes into anodes, is made outside China (Benchmark Mineral Intelligence). In gallium, the US Geological Survey puts China's share of primary low-purity production at 99 per cent, in a global market whose entire primary output is under a thousand tonnes a year.
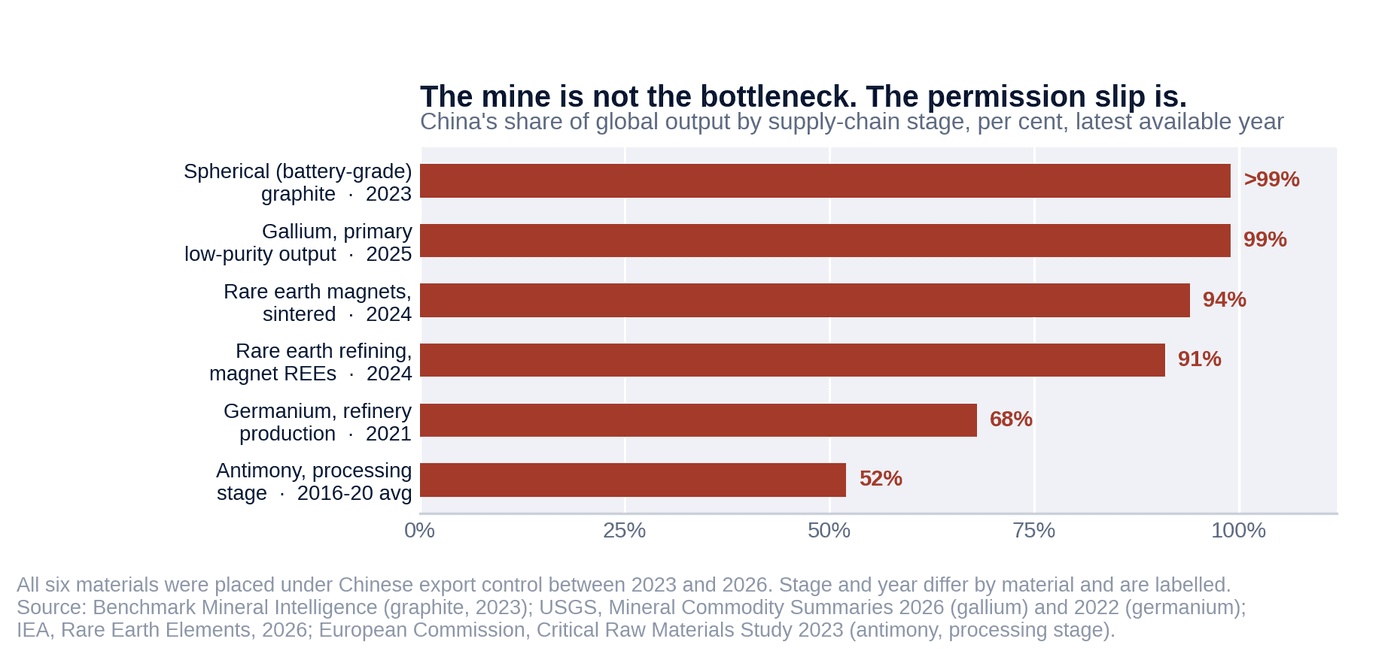
And Beijing has been willing to use the position. Since 2023 China has placed export controls on gallium and germanium, then graphite, then antimony, then tungsten, tellurium, bismuth, molybdenum and indium, then rare earths in successive rounds. In January 2026 it tightened dual-use export controls in a measure directed specifically at Japan (China Ministry of Commerce, consolidated in METI). The mine is no longer the bottleneck. The permission slip is.
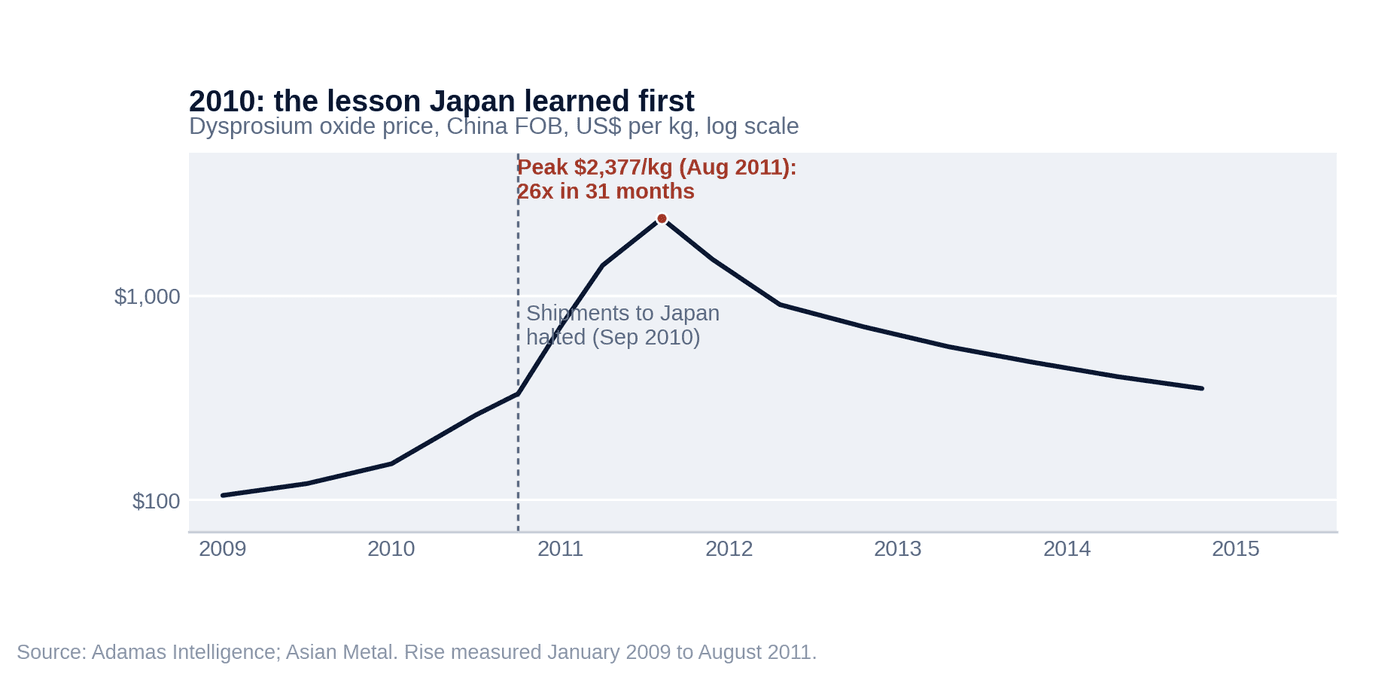
Japan felt this earlier than anyone. In 2010, in the middle of a territorial dispute, China halted rare earth shipments to Japan. At the time, roughly nine-tenths of Japan's rare earths came from China (Japan Ministry of Finance). Dysprosium oxide rose twenty-six fold between January 2009 and August 2011 (Adamas Intelligence; Asian Metal), Japanese manufacturers stared into their supply chains, and Tokyo learned the modern lesson a decade before the rest of the world: supply chains can be weaponised, and a stockpile is not a strategy.
The policy response has been compounding ever since. Japan passed its Economic Security Promotion Act in 2022 and built the institutions to match, with JOGMEC, the state resources organisation, evolving into an instrument for strategic investment abroad. In July 2026 the government pulled the threads together in its new Growth Strategy: seventeen strategic fields, sixty-two designated key products and technologies, and more than ¥370 trillion of expected public and private domestic investment across them by FY2040 (Cabinet Secretariat). Two of those seventeen fields matter directly for this report: materials, meaning critical minerals and components, and resource and energy security.
The important thing is not the size of the number. It is the architecture. Industrial policy, economic security, government finance, private capital and technology are being pointed at the same targets, together. That is not the environment in which Australia's resource industry grew up. It is, however, an environment Australia has seen once before, in the 1960s, from the same country.
Fifty years ago, “the Japanese are coming” was said in Australia with a degree of nervousness. This time it should be read as an invitation.
06
The Rehearsal Nobody Noticed: Lynas, 2011
The Takeaway
Japan answered the 2010 shock with a chequebook, not a communique. US$250 million into Lynas built the largest producer of separated rare earths outside China and cut Japan's dependence from about 90 per cent to 58 per cent. It has since climbed back above 70 per cent. That is the case for the Second Wave, not against it.
Between the two waves sits a project that proves the model, and almost nobody frames it this way.
After the 2010 rare earth shock, Japan did not respond with a communique. It responded with a chequebook. In 2011, Sojitz and JOGMEC together put roughly US$250 million into Lynas, an Australian rare earths company that the conventional market would not fund at the scale required, in exchange for supply of rare earth products into Japan (JOGMEC; Sojitz; Lynas disclosures). Strategic customer, strategic capital and offtake, arriving together, before the industry existed. Moura logic, applied to magnets instead of coal.
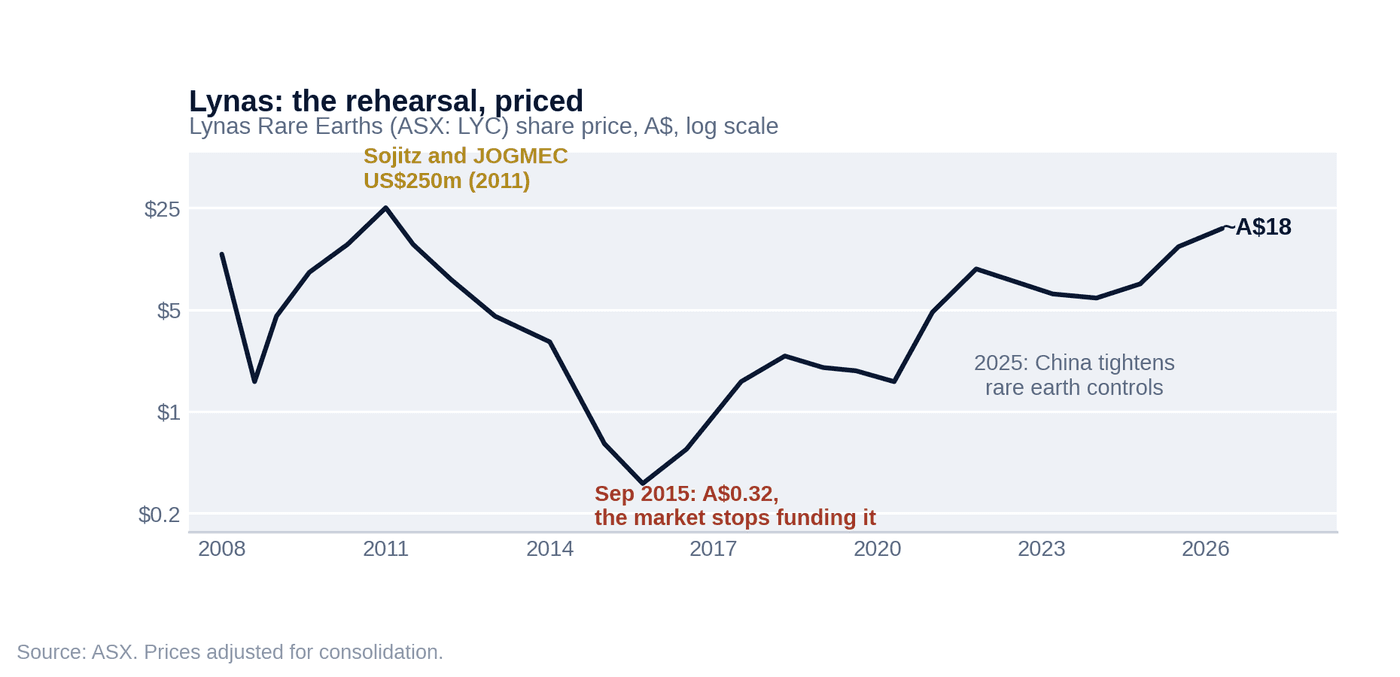
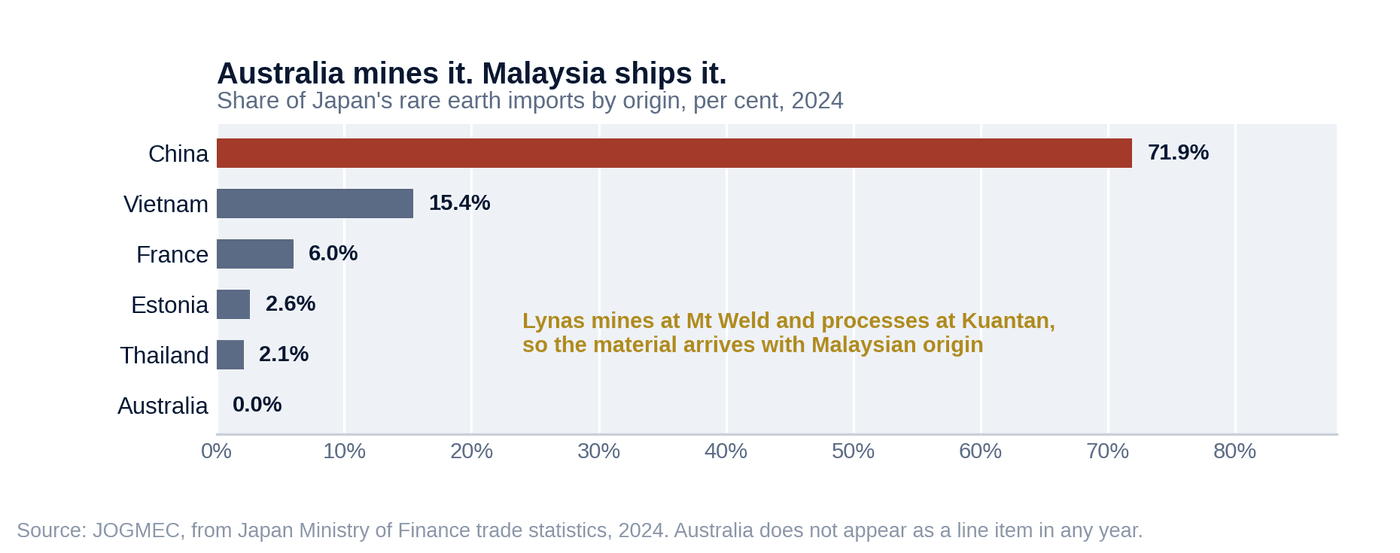
The result was real. Lynas became the largest producer of separated rare earths outside China, and China's share of Japan's rare earth imports fell from roughly 90 per cent before the shock to 57.8 per cent by 2018 (Japan Ministry of Finance; JOGMEC). Tokyo had bought itself a second supplier and something close to thirty points of independence, from a single transaction.
Then it gave much of that back. On JOGMEC's own figures, China's share climbed to 68.6 per cent in 2021 and 71.9 per cent in 2024, and monthly data through 2026 has been running higher still (Bloomberg, February 2026). Japanese demand grew faster than non-Chinese supply, no second Lynas was built at scale, and the diversification stalled.
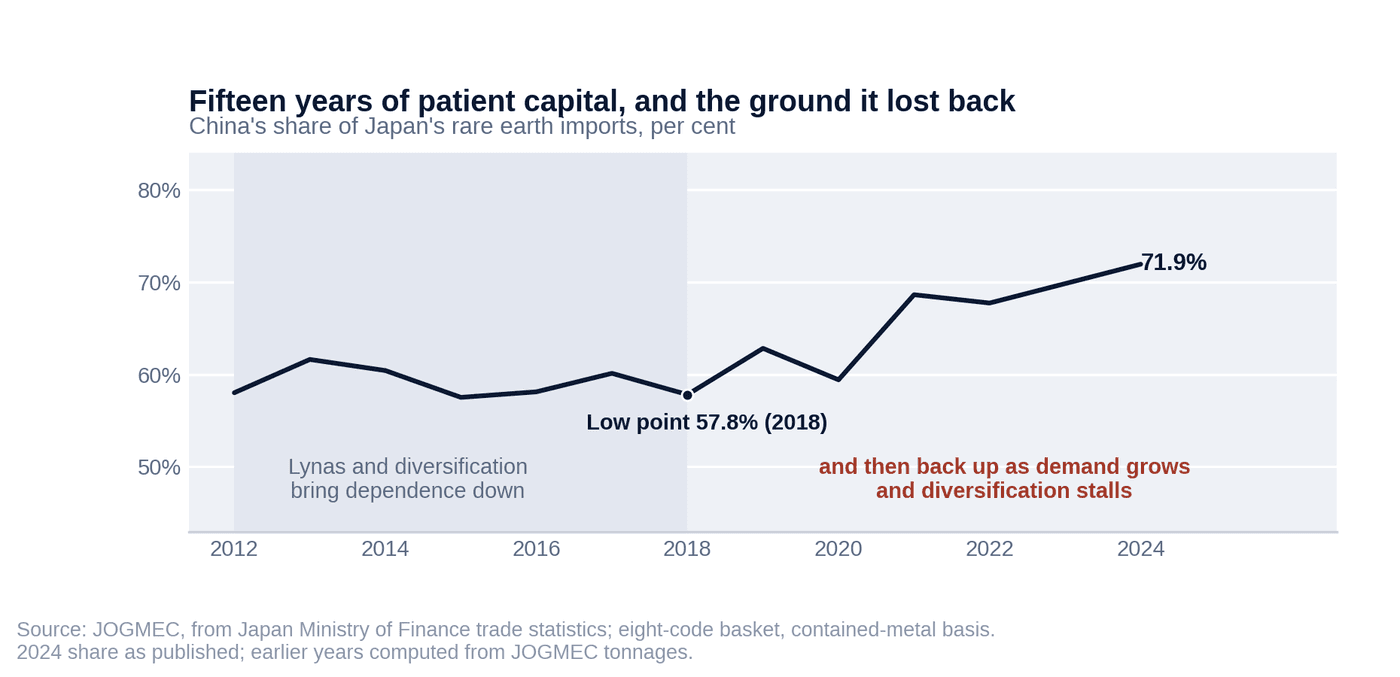
We think that is the most important fact in this report, and it argues for the thesis rather than against it. One improvisation in 2011, executed by a single trading house and a single state agency, bought fifteen years and thirty points of dependence. It was never repeated at scale, and the gains eroded. What is being assembled now is that same instrument with a standing budget, a policy framework, six named projects and a bilateral treaty structure behind it. The Second Wave is not a victory lap for 2011. It is the response to what happened after it.
There is a second lesson buried in the trade data, and it is an uncomfortable one for Australia. Lynas mines at Mt Weld in Western Australia and processes at Kuantan in Malaysia. The material therefore enters Japan with Malaysian origin, and Australia does not appear as a line item in Japan's rare earth import statistics in any year (JOGMEC, from Japan Ministry of Finance trade statistics). Australia supplied the geology. Somebody else captured the midstream, and the customs data records it that way. That is precisely the gap the Second Wave is meant to close.
07
The Second Wave Mechanism: Who Carries the Risk
The Takeaway
The Second Wave re-orders the queue of capital. The customer arrives first, the offtake exists before the plant, and strategic money absorbs the risks the ASX prices worst. The market is not overruled: a second, slower pool of capital is added to the stack.
Strip the announcements away and the Second Wave is a change in one thing: the sequencing of capital, and therefore who carries which risk.
The model Australia grew up with runs in one direction. Discover, raise, drill, raise again, study, raise again, and only then, years and hundreds of millions of dollars in, go looking for the customer and the project finance. The company carries the development risk, the processing risk and the market risk the whole way, which is precisely why so many strategic projects die between discovery and construction.
The customer arrives early instead of last. The offtake exists before the plant does. Strategic capital, Japanese and governmental, absorbs the risks the ASX prices worst: development, processing, qualification, market. Institutional capital then arrives into a de-risked structure rather than a story.
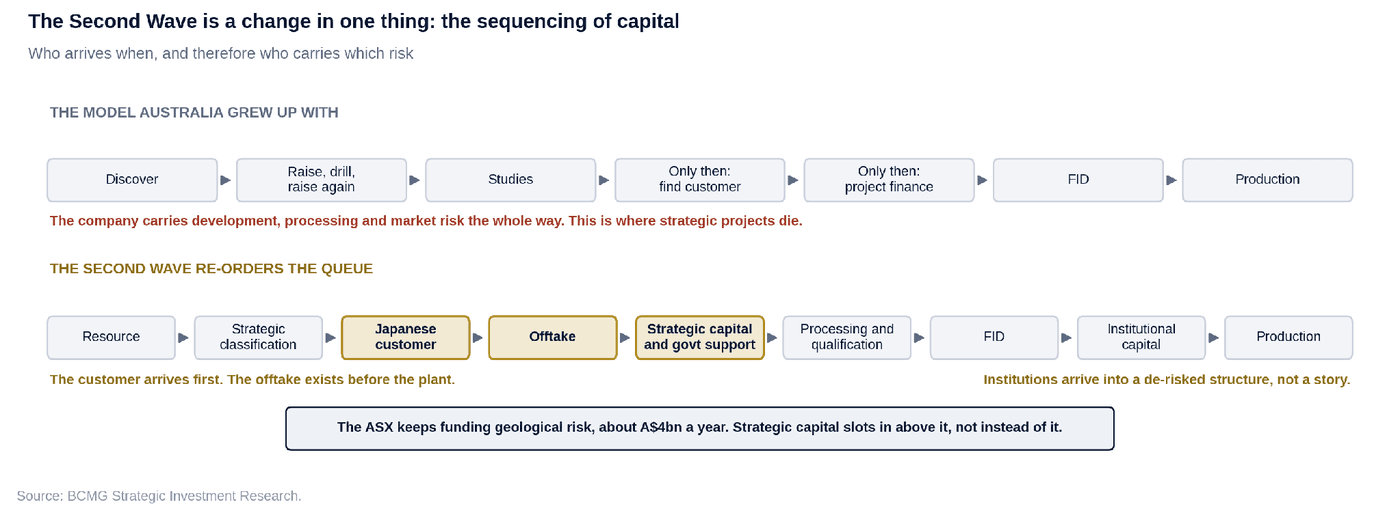
Notice what this does not do. It does not replace the Australian market, and it should not. The ASX keeps doing the thing it does better than anyone, which is funding geological risk, four billion dollars of it a year (ABS). Strategic capital slots in above it, funding the layers retail money was never built to carry. Australia's discovery machine is democratic and speculative. Japan's development machine is patient and strategic. The Second Wave is what happens when the two are plugged into each other.
That is the answer to the question we are asked most often about this thesis. Yes, it is a genuinely new way of allocating capital to Australian resources, and yes, it is more strategic. Not because the market is being overruled, but because a second, slower, security-motivated pool of capital is being added to the stack, and it changes which projects clear the bar.
08
The Evidence: May 2026, Six Projects, and a Refinery in Wagerup
The Takeaway
On 4 May 2026 the two governments named six projects; in July, Wagerup reached a final investment decision. No new mine, no drill hole: gallium recovered from a refinery built decades ago. Some of the Second Wave will simply switch on value Australia's industrial base already contains.
Until recently this was a framework in search of proof. It now has dates and dollar figures.
On 4 May 2026, Australia and Japan elevated critical minerals to a core pillar of the economic-security relationship. The Joint Statement on Elevated Critical Minerals Cooperation is explicit that the target is the whole chain: mining, refining and downstream manufacturing. Australia committed support of up to A$1.3 billion through the A$4 billion Critical Minerals Facility and Export Finance Australia for critical minerals projects involving Japan. Japan, through JOGMEC, had already provided approximately A$370 million in investments and grants to identified projects, with more flagged as projects progress (MOFA and PM&C; Export Finance Australia).
The statement did something governments rarely do: it named names. Six projects, each a different expression of the same model.
| Project | Material | Japanese involvement | Expression of the model | Stage |
|---|---|---|---|---|
| Lynas Rare Earths (WA) | Light and heavy rare earths | Sojitz; JOGMEC | The 2011 rehearsal, now the flagship | Producing |
| Alcoa Gallium Recovery, Wagerup (WA) | Gallium | JOGMEC; Sojitz; allied govt bodies | By-product from existing refinery infrastructure | FID, Jul 2026 |
| Magnium (WA) | High-purity magnesium | Trading-house involvement | Qualification and purity as the moat | Development |
| Tivan Speewah Fluorite (WA) | Acid-grade fluorite | Japanese partner and offtake talks | Semiconductor and EV chemistry inputs | Development |
| RZ Resources Copi (NSW) | Mineral sands (rare earth feed) | Offtake-led engagement | Brownfield provinces reconnected | Development |
| Ardea Kalgoorlie (WA) | Nickel and cobalt | Japanese consortium (study phase) | The discipline test: cost curve versus strategy | Feasibility |
Source: Ministry of Foreign Affairs of Japan and PM&C, Joint Statement on Elevated Critical Minerals Cooperation, 4 May 2026; JOGMEC and Sojitz releases; company disclosures.
Two months later, the model went physical. On 15 July 2026, JOGMEC, Sojitz, Alcoa and government-related organisations from Australia and the United States announced a final investment decision for gallium production at Alcoa's Wagerup alumina refinery in Western Australia, with a portion of output to be supplied to Japan (JOGMEC and Sojitz releases).
Sit with what Wagerup actually is, because it is the purest expression of the thesis. Gallium is a metal whose primary production China controls almost entirely, 99 per cent on USGS numbers, and which Beijing has restricted for export since 2023. The entire global primary market is under a thousand tonnes a year. Australia's answer involves no new mine, no new discovery, no drill hole. The gallium was already flowing through the Bayer liquor of an alumina refinery built decades ago; nobody had a reason to recover it until security of supply became the reason. Strategic demand, Japanese capital, allied government support and existing Australian industrial infrastructure, assembled into a new critical-material supply chain in the time it usually takes a junior to complete a scoping study.
The First Wave built new provinces. The Second Wave, at least some of the time, will simply switch on value that Australia's industrial base already contains.
09
Where the Model Applies, and Where It Doesn't
The Takeaway
One model, six lessons. Rare earths lead, by-products and qualification create the moats, and nickel tests the discipline. Strategic capital can pay for diversification; it cannot make an uncompetitive cost position competitive.
The six named projects sketch the map, and each carries a different lesson.
Rare earths are the most advanced case. Australia hosts the only meaningful separated supply outside China, and the bilateral framework is explicitly about pushing further downstream: separation, purification, and the path toward magnet materials. The honest caveat is scale. China still refines 91 per cent of the world's magnet rare earths and makes 94 per cent of its sintered magnets (IEA), at costs strategic capital cannot simply legislate away. The prize is resilience with acceptable economics, not cost leadership.
Gallium shows the by-product route. The strategic asset was an existing refinery, not a deposit. The right question for Australian industry is how many more Wagerups are hiding inside existing operations: metals and compounds already passing through Australian circuits that were never worth recovering until “trusted supply” became a product attribute.
Fluorite and magnesium show the qualification route. Nobody strategically needs rock. Japan needs acid-grade fluorspar and high-purity magnesium that its manufacturers have tested, qualified and approved. The value, and the moat, sit in purity, consistency and the qualification relationship, all of which live downstream of the mine.
Mineral sands show the brownfield route: existing Australian provinces and processing know-how, reconnected to a strategic customer for materials that were previously afterthoughts in the product suite.
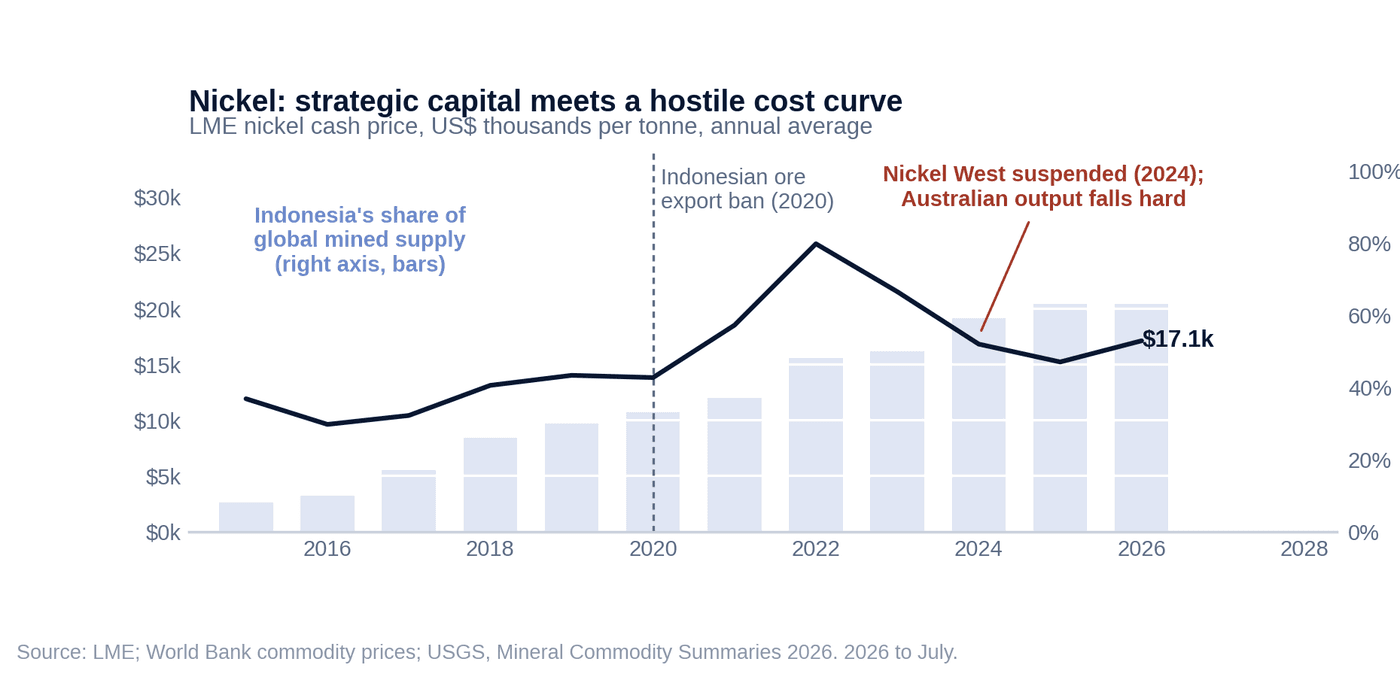
Nickel is on the list precisely because it tests the discipline. Australia has resources, infrastructure and deep Japanese relationships. It also has a nickel industry that spent 2024 going into care and maintenance, BHP's Nickel West included, because Indonesia now accounts for more than half of global mined supply and crushed the price (USGS; company announcements). Japanese participation can value diversification; it cannot make an uncompetitive cost position competitive. The correct question is not whether Japan wants non-Indonesian, non-Chinese nickel units. It is whether a specific Australian project can deliver them at a cost that survives without a permanent strategic premium. Some will. Most will not.
Hydrogen, ammonia and green iron sit one horizon further out. The complementarity is real: Australian land, renewables and iron ore against Japanese capital, technology and industrial demand, in a country that imports more than eighty per cent of its energy (METI). The economics are not yet. We treat these as strategic options, not assumed winners, and we would be suspicious of anyone who treats them otherwise in 2026.
10
The Discipline: Strategic Does Not Mean Uneconomic
The Takeaway
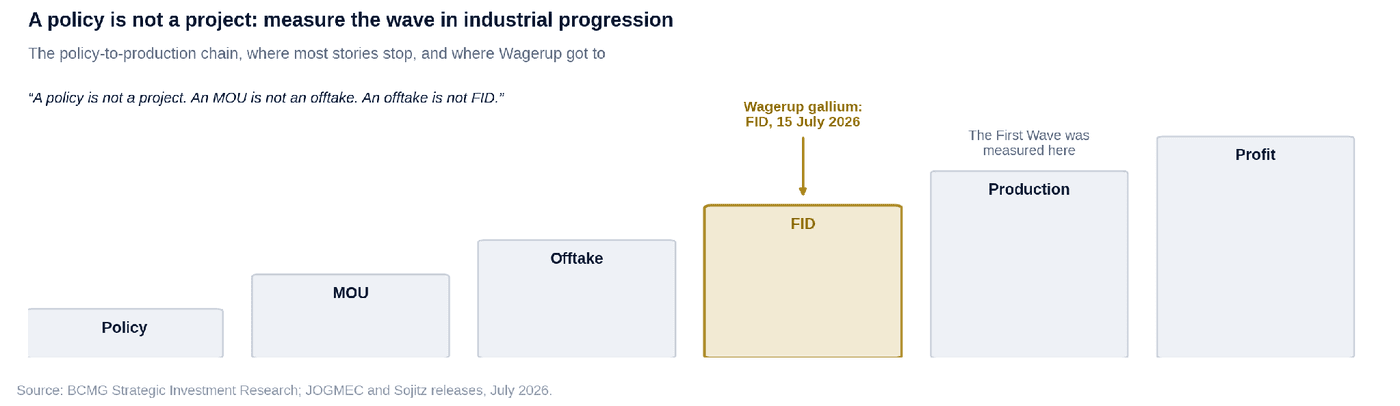
Strategic does not mean uneconomic. The BCMG equation is multiplicative: if any term is zero, the product is zero, and commercial economics is the filter, not the footnote. Measure the wave in industrial progression, not announcement flow.
This is the section we would ask readers to hold us to.
The Second Wave must never become an excuse for funding bad projects with patriotic arguments. Strategic importance and commercial viability are different properties. A project can be genuinely critical to Japanese industry and still be a terrible use of capital. Government support reduces risk; it does not repeal operating costs, construction blowouts, technology failure, competitor response or qualification timelines. Australia's own nickel industry has just demonstrated, at scale, what happens when strategic relevance meets a hostile cost curve. The graveyard of Australian resources is full of projects that had everything except economics.

If any term is zero, the product is zero. The last term is the filter, not the footnote.
The same discipline applies to progress. A policy is not a project. An MOU is not an offtake. An offtake is not FID. FID is not production, and production is not profit. The First Wave was measured in shipped tonnes, and the Second Wave should be measured the same way: by industrial progression, not announcement flow. Wagerup matters precisely because it crossed the line that most stories never reach.
11
The BCMG Second Wave Scorecard
The Takeaway
Eight dimensions, one purpose: separating Second Wave projects from Second Wave press releases.
We assess opportunities across eight dimensions.
01 · Japanese strategic demand
How important is this material to Japanese industry, and how anxious is Tokyo about it?
02 · Supply concentration
How hard is the incumbent chain to diversify away from? A 99% supplier is a different problem from a 60% supplier.
03 · Australian advantage
Why should this supply chain live in Australia rather than anywhere else offering the same reassurance?
04 · Processing opportunity
Which downstream layer can Australia actually capture and defend?
05 · Japanese corporate fit
Is there an identifiable customer, trading house or technology partner, or only a hypothetical one?
06 · Strategic capital
Can JOGMEC, trading-house or government capital genuinely change the financing sequence?
07 · Commercial economics
Does the project work if the strategic premium fades?
08 · Execution maturity
How far along the policy-to-production chain has it actually moved?
| Project | 01 | 02 | 03 | 04 | 05 | 06 | 07 | 08 |
|---|---|---|---|---|---|---|---|---|
| Lynas (rare earths) | 5 | 5 | 5 | 5 | 5 | 5 | 3 | 5 |
| Alcoa Wagerup (gallium) | 5 | 5 | 4 | 4 | 5 | 5 | 4 | 5 |
| Magnium (magnesium) | 4 | 3 | 3 | 4 | 4 | 3 | 2 | 2 |
| Tivan (fluorite) | 4 | 4 | 3 | 4 | 4 | 3 | 3 | 2 |
| RZ Resources (mineral sands) | 3 | 3 | 4 | 3 | 3 | 3 | 3 | 2 |
| Ardea (nickel-cobalt) | 3 | 2 | 4 | 3 | 4 | 4 | 1 | 2 |
BCMG Second Wave scorecard, illustrative assessment of the six named projects, 1 weak to 5 strong. Source: BCMG Strategic Investment Research, from public information, August 2026. Column 07, commercial economics, is the filter. Screening tool, not a recommendation.
The scorecard is a screening tool, not a recommendation. Its purpose is to separate Second Wave projects from Second Wave press releases.
12
What Changes for Companies and Investors
The Takeaway
A Japan strategy is a capital structure, not a delegation. The better screen is no longer who has the biggest deposit but which supply chain would be hardest to replace. Strategic capital changes who carries risk; it does not abolish it.
For Australian resource companies, the strategic question has changed shape. It is no longer “can we sell into Japan?” It is “can Japanese strategic demand help us build a more valuable Australian supply chain?” That means identifying the customer, the qualification pathway, the processing layer, the technology partner and the government mechanism before booking the flight to Tokyo, not after. A Japan strategy is a capital structure, not a delegation.
For investors, the screen inverts. The old question was who has the biggest deposit. The better question is which supply chain would be hardest to replace. The next important Australian resource company may not own the largest orebody in its commodity. It may be the one that assembles resource, customer, capital, technology and qualification into a chain that Japan cannot easily live without. That is a harder test than exploration success. It is also where we think the outsized value of the next decade sits.
And for both, the same warning. Strategic capital changes who carries risk. It does not abolish it.
13
Conclusion: The Second Wave
The Takeaway
Japan's insecurity, converted through capital, became Australia's endowment once before. The fear has changed from oil to supply chains, but the instinct and the machinery are the same. Australia brings the discovery machine; Japan now supplies the patient capital that carries projects across the valley.
The First Wave began with Japanese fear and ended with an Australian economy. The 1973 oil shock exposed a country drawing three-quarters of its energy from imported oil (METI), Japanese trading houses became investors rather than traders, long-term contracts became financing instruments, and Australia's coal, iron ore and LNG industries were built on the confidence they created. Japan's insecurity, converted through capital, became Australia's endowment, and Japan spent 36 years as Australia's largest trading partner collecting the other side of the bargain.
The fear has changed. Japan's vulnerability today is not the oil tanker but the supply chain: concentrated to the point where one country refines 91 per cent of the magnet rare earths and produces 99 per cent of the gallium (IEA; USGS), and demonstrably willing to use that position, most recently in a January 2026 measure aimed specifically at Japan. Japan's response is the same instinct with modern machinery: seventeen strategic fields, sixty-two key products carrying a ¥370 trillion investment ambition, a state investor in JOGMEC, trading houses back in their 1960s role, and a bilateral framework that names Australian projects individually and puts A$1.3 billion of Australian and A$370 million of Japanese public capital behind them.
The urgency is measurable. Japan tried this once, in 2011, with one cheque and one company, and cut its dependence on Chinese rare earths from about 90 per cent to 58 per cent. It then watched that number climb back above 70 per cent (JOGMEC) because the experiment was never repeated at scale. The Second Wave is what repeating it at scale looks like.
Australia's side of the bargain has changed too. Last time, Australia supplied geology and hosted the capital. This time it brings fifty years of operating capability, a democratic discovery machine that still spends close to A$4 billion a year looking for the next deposit (ABS), and existing industrial infrastructure with strategic materials already flowing through it. What it has lacked is the patient capital to carry projects across the valley between discovery and production. That is precisely the capital Japan has begun to supply.
The tonnages will be smaller this time. A national gallium supply is measured in tens of tonnes, not tens of millions. But the First Wave's lesson was never really about tonnes. It was that when Japanese strategic need is converted into customers, contracts and capital, Australian resources that could not otherwise be developed get developed, and both countries compound off the result for half a century.
Australia does not need to discover another continent. It needs a better way to develop the one it already has. For forty years, mums, dads and the ASX funded the discovering. The Second Wave adds the partner that funds what comes next.
Australia plus Japan is no longer just more commodities. It is strategic supply chains, built together.
That is the Second Wave.
Comparison
The First Wave and the Second Wave Compared
Same instinct, different machinery
| Dimension | First Wave | Second Wave |
|---|---|---|
| Strategic shock | 1973 oil crisis | Supply-chain concentration and export controls |
| Japan's problem | Energy and raw-material security | Economic and industrial security |
| Australian resource | Coal, iron ore, LNG | Critical minerals and strategic materials |
| Japanese actors | Trading houses, steel mills, utilities | Trading houses, JOGMEC, corporates, government |
| Capital model | Long-term contracts plus equity | Offtake plus strategic capital plus government support |
| Technology | Mining and infrastructure | Processing, purification, qualification |
| Output | Commodities in bulk | Qualified strategic materials |
| Scale | Hundreds of millions of tonnes | Sometimes hundreds of tonnes |
| Measure of success | Tonnes shipped | Supply chains that cannot be bypassed |
| Australia's role | Develop the resource | Capture the supply chain |
Source: BCMG Strategic Investment Research.
14
Sources and Notes
Show full sourcing and methodology notes
How to read the sourcing. Every factual claim in the body text carries a short source tag in brackets naming the publishing body. The full citation for each, with edition, table and release date, appears in the notes below, grouped by theme. Figures that are our own construction rather than a published series are labelled as such on the figure itself and listed at the end of this section.
Trade and investment. Two-way trade of A$97.5 billion (2025), Japan as third-largest trading partner and second-largest export market (A$65.1 billion), total Japanese investment of A$282.9 billion and direct investment of A$159.5 billion (12.5 per cent of FDI stock, end-2024): DFAT, Japan country brief; ABS, International Investment Position Australia: Supplementary Statistics, Table 2 (reference year 2025, released 6 May 2026). Japan's 36 years as Australia's largest trading partner from the early 1970s, and the longer run from 1966-67 to 2009-10 as largest export market alone: DFAT, Composition of Trade and Fifty Years of Australia's Trade. Australia's record A$466 billion of resources and energy exports in 2022-23 and the FY2026 and FY2027 forecasts: Office of the Chief Economist, Resources and Energy Quarterly, June 2026, Historical Tables. Australia supplying 43 per cent of Japan's LNG imports and 66 per cent of coal (CY2022), and about half of Japan's iron ore imports: Australian Embassy Tokyo, Australia-Japan resources and energy relationship; Japan Customs, Trade Statistics of Japan (HS 2711.11, 2701, 2601); Austrade.
First Wave history. The 1957 Commerce Agreement, the 1938 iron ore export embargo (partially lifted from late 1960 for limited exports from smaller deposits; fully lifted for major high-grade deposits, including the Pilbara, in 1966) and the 1973 oil shock: National Museum of Australia; Australian government and parliamentary histories. Japanese energy structure in 1973, with oil at 75.5 per cent of primary energy and almost entirely imported: METI Agency for Natural Resources and Energy, Comprehensive Energy Statistics. Crude oil prices, Arabian Light: Energy Institute, Statistical Review of World Energy 2026; EIA. Moura (1963) as Mitsui's first Australian resource investment and Australia's first export coal mine, with Thiess and Peabody, and Mitsui funding exploration: Mitsui & Co. (Australia) corporate history; Austrade. Mt Newman (1965) and the North West Shelf (one-sixth held jointly by Mitsui and Mitsubishi): Austrade. Australian iron ore production and coal production, with black coal output of about 48.5 million tonnes in 1970 and roughly 100 million tonnes of saleable production by 1983: US Bureau of Mines, Minerals Yearbooks; Geoscience Australia; Australian parliamentary history of the coal industry.
The Australian capital machine. Mineral exploration expenditure, quarterly, and the split between new and existing deposits: ABS, Mineral and Petroleum Exploration Australia, Table 3b (March 2026 quarter, released 2 June 2026). Spend peaked at A$4.27 billion in 2023 and has since eased to about A$3.9 billion; more than two-thirds is brownfields work around known deposits. Corporate exploration budgets by country for 2025, with Canada at US$2.32 billion, Australia at US$1.86 billion, the United States at US$1.46 billion and Chile at US$0.88 billion: S&P Global Market Intelligence, World Exploration Trends 2026 (PDAC special edition, March 2026). ASX as the exchange with the most listed resources companies: ASX. Poseidon (1969-70) share price from about 80 cents to a peak near $280: ASX records and standard Australian market histories; the price path shown is indicative, with anchor points labelled. The capital valley figure is a BCMG schematic, not a measured series.
Japan's strategic position. Energy self-sufficiency of 16.4 per cent in FY2024 on the IEA basis (19.7 per cent on METI's higher-heating-value basis; 13.3 per cent in FY2021) and the 30 to 40 per cent target for FY2040 under the 7th Strategic Energy Plan: METI Agency for Natural Resources and Energy, Japan's Energy 2025 and Comprehensive Energy Statistics, FY2024 final (released 14 April 2026). Pre-1990 self-sufficiency is on the earlier methodology. China's 91 per cent share of global refined output of magnet rare earths and 94 per cent of sintered permanent magnet production, both 2024: IEA, Rare Earth Elements (2026). Spherical, battery-grade graphite, with less than one per cent of uncoated spherical graphite produced outside China in 2023: Benchmark Mineral Intelligence. China's 99 per cent share of primary low-purity gallium production and the 900-tonne scale of the global primary market in 2025: USGS, Mineral Commodity Summaries 2026 (6 February 2026); the gallium series is compiled from successive editions, with 2024 and 2025 as revised in the 2026 edition. Germanium at 68 per cent is refinery production in 2021, the last year USGS published the series: USGS, Mineral Commodity Summaries 2022; USGS Open-File Report 2024-1057 puts China at 86 per cent of primary refined germanium in 2022. Antimony at 52 per cent is the processing stage on a 2016-20 average: European Commission, Study on the Critical Raw Materials for the EU 2023. USGS publishes no world refinery data for antimony, and its mine-production share is volatile, having been revised from 60 per cent to 34 per cent for 2024 between the 2025 and 2026 editions; S&P Global puts Chinese and Russian controlled operations at about 81 per cent of world antimony processing capacity in 2025. Chinese export controls, in sequence: gallium and germanium (August 2023), graphite (December 2023), antimony (September 2024), tungsten, tellurium, bismuth, molybdenum and indium (February 2025), seven medium and heavy rare earths (April 2025), further rare earths and rare earth technologies (October and November 2025), and a strengthening of dual-use controls directed specifically at Japan (January 2026): Chinese Ministry of Commerce announcements, consolidated in METI, Materials (Critical Minerals and Components) Sector: Issues and Direction, 19 February 2026. The 2010 rare earth halt to Japan, and dysprosium oxide rising twenty-six fold between January 2009 and August 2011 to a peak of US$2,377 per kilogram: Adamas Intelligence; Asian Metal; contemporaneous coverage and Japanese government accounts.
Japan's rare earth dependence.China's share of Japan's rare earth imports: JOGMEC, Trends in China's Strengthening of Rare Earth Controls, 31 July 2025, built from Japan Ministry of Finance trade statistics on an eight-code basket (HS 280530000, 284610010, 284610090, 284690210, 284690220, 284690290, 360690000 and 382499500) converted to contained-metal tonnes. The 2024 share of 71.9 per cent is published by JOGMEC; the 2012 to 2023 shares are computed from JOGMEC's published tonnages in the same table. The pre-shock figure of roughly 90 per cent is from Japan Ministry of Finance (89.8 per cent in 2010 on the narrower HS 2805.30 basket). On that narrower basket the 2024 share is 62.9 per cent; the two figures differ because the baskets differ, and we use the wider JOGMEC series throughout because it captures the oxides and compounds that feed Japanese magnet production. Monthly data for 2026 showing China's share running higher still: Bloomberg, 26 February 2026. Australia does not appear as a line item in Japan's rare earth import statistics in any year, because Lynas processes Mt Weld material at Kuantan in Malaysia and the product therefore enters Japan with Malaysian origin. Lynas as the largest separated rare earths producer outside China, the 2011 Sojitz and JOGMEC package of roughly US$250 million, and Sojitz's commencement of Australian-sourced heavy rare earth imports in 2025: JOGMEC, Sojitz and Lynas disclosures.
Second Wave policy and projects.Japan's Growth Strategy, Cabinet decision of 21 July 2026: 17 strategic fields, 62 key products and technologies, and cumulative public and private domestic investment across those 62 items of more than ¥370 trillion by FY2040: Cabinet Secretariat, Japan Growth Strategy and the accompanying investment roadmap. The Japan-Australia Joint Statement on Elevated Critical Minerals Cooperation, signed 4 May 2026: up to A$1.3 billion via the Critical Minerals Facility and Export Finance Australia, approximately A$370 million of JOGMEC investments and grants, coverage of mining, refining and downstream manufacturing, and the six named projects (Lynas Rare Earths; Alcoa Gallium Recovery; Magnium; Tivan Speewah Fluorite; RZ Resources Copi Critical Minerals; Ardea Resources Kalgoorlie Nickel): Ministry of Foreign Affairs of Japan; PM&C. The A$4 billion Critical Minerals Facility: Export Finance Australia. The Wagerup gallium final investment decision of 15 July 2026 by JOGMEC, Sojitz, Alcoa and Australian and US government-related organisations: JOGMEC and Sojitz releases. Indonesia at more than half of global mined nickel, LME nickel prices and the 2024 care-and-maintenance decisions in Western Australia including BHP's Nickel West: USGS, Mineral Commodity Summaries 2026; LME; World Bank commodity price data; company announcements.
Note on BCMG constructions. Three figures in this report are our own constructions rather than published series, and are labelled as such on the figure: the capital valley schematic, the Second Wave sequencing diagram, and the Second Wave scorecard. The scorecard is an illustrative assessment from public information and is a screening tool, not a recommendation.
This report is intended for research and informational purposes only. It does not constitute financial advice, an offer or solicitation to buy or sell securities, or a guarantee of investment outcomes.
BCMG Insights · Strategic Investment Research · August 2026
Have a Question on the Second Wave?
Speak with our senior team about critical minerals, strategic capital and the Japan-Global corridor.
Get in Touch